The reality is that neither of the major parties can reasonably claim to be ‘better economic managers’ than the other.
Australia’s major political parties like to claim particular areas of policy ‘turf’ as their own home grounds. For Labor, it’s usually health and education; for the Coalition, it’s typically ‘national security’ and economic management. How true are the Coalition’s claims to be ‘better economic managers’ than Labor?
As Prime Minister, John Howard would repeatedly claim that “interest rates would always be lower under the Coalition than under Labor”, an assertion repeated in the present campaign by the Coalition’s designated campaign spokesperson, Senator Anne Ruston, who went on to claim that “we always have lower unemployment rates, we always make sure that people have more of their taxes left in their pockets, they can keep more of what they earn”.
How true are the Coalition’s claims to be ‘better economic managers’ than Labor?
There are two dimensions to any assessment of these claims. First, what does the available data tell us about different aspects of the Australian economy’s performance under Coalition and Labor Governments. And second, but no less importantly, to what extent can governments, of either political persuasion, reasonably credited with (or blamed for) different aspects of the economy’s performance on their ‘watch’?
What do the numbers say?
Beginning with economic growth, Chart 1 shows Australia’s real GDP growth rates of the terms of office of Australia’s past six governments – from the Whitlam Government to the Abbott-Turnbull Morrison Government[1]. Real GDP growth averaged 3.7% per annum during the term of the Howard Government, higher than under any of Australia’s other five governments over the past fifty years. But real GDP growth under the current Coalition Government has averaged 2.3% per annum – less than the 3.4% per annum under Hawke-Keating Government, or the 2.5% per annum under the Rudd-Gillard-Governments. Over the past fifty years, real GDP growth has averaged 2.7% under both Labor and Coalition Governments. If you exclude the periods of the Whitlam and Fraser Governments, the real GDP growth has averaged 3.0% per annum under Labor Governments and 2.9% under Coalition Governments over the past 39 years. Abstracting from the contribution to real GDP growth of growth in Australia’s population, per capita real GDP growth has averaged 1.4% per annum under Coalition Governments and 1.1% per annum under Labor Governments over the past 50 years: or, if the Whitlam and Fraser Governments are excluded, by 1.5% per annum and 1.3% per annum, respectively.
These differences are too small to be considered definitive.
[1] Governments’ terms in office don’t co-incide neatly with the periods for which economic data are available – particularly those such as real GDP growth and inflation which are only available quarterly. For the purposes of this article, the Whitlam Government’s term in office is taken as running from the March quarter 1973 to the December quarter 1975; the Fraser Government’s from the March quarter 1976 to the March quarter 1983; the Hawke-Keating Government’s from the June quarter 1983 to the March quarter 1996; the Howard Government’s from the June quarter 1996 to the December quarter 2007; the Rudd-Gillard-Rudd Government’s from the March quarter 2008 to the September quarter 2013; and the Abbott-Turnbull Morrison Government’s from the December quarter 2013 to the December quarter 2021 or March quarter 2022, depending on the latest available data point.
Chart 1: Average rates of real GDP growth under Coalition & Labor Governments
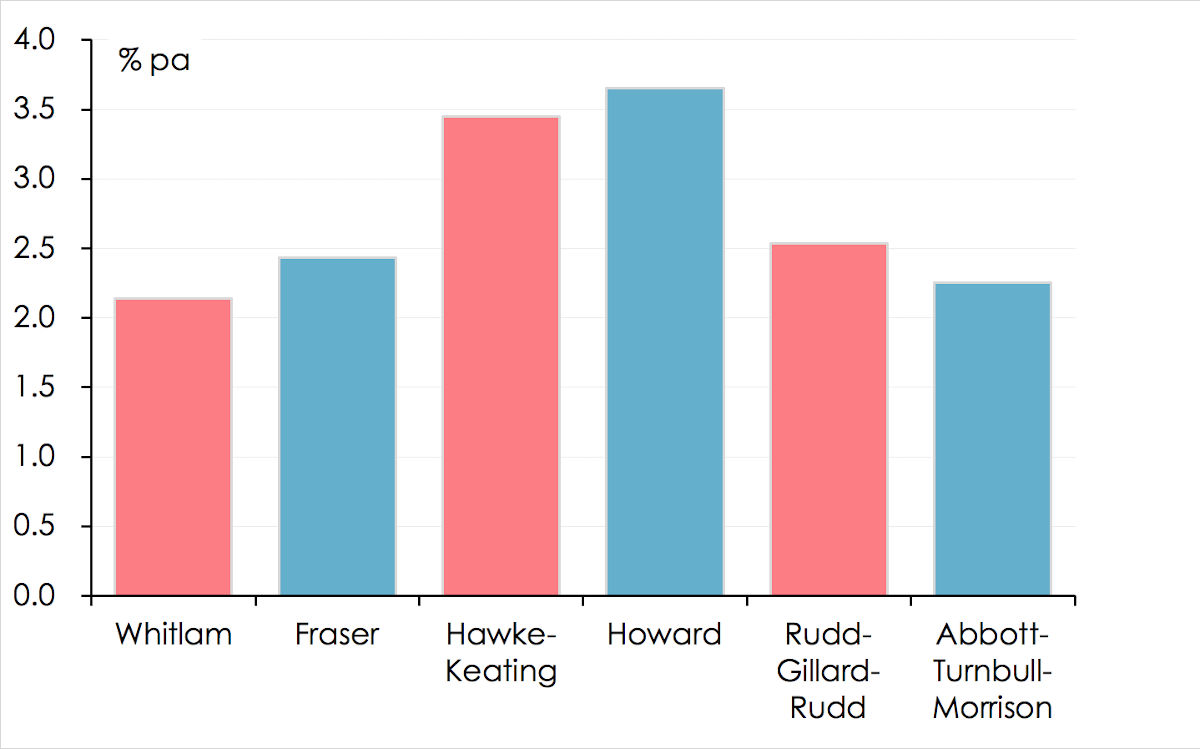
Source: ABS, Australian National Accounts: National Income, Expenditure and Product, December 2021.
Another important dimension of economic management is employment growth. As shown in Chart 2, the Howard Government presided over employment growth averaging 2.1% per annum during its 11½ years in office, marginally above the average of 2.0% per annum during the 13 years for which the Hawke-Keating Government was in power. On average over the past fifty years, employment growth has averaged 1.6% per annum under Labor Governments, and 1.4% per annum under Coalition Governments; or, by 1.7% and 1.9% respectively if the periods of the Whitlam and Fraser Governments are excluded.
Again, these differences are two small to be regarded as definitive.
Chart 2: Average rates of employment growth under Coalition & Labor Governments
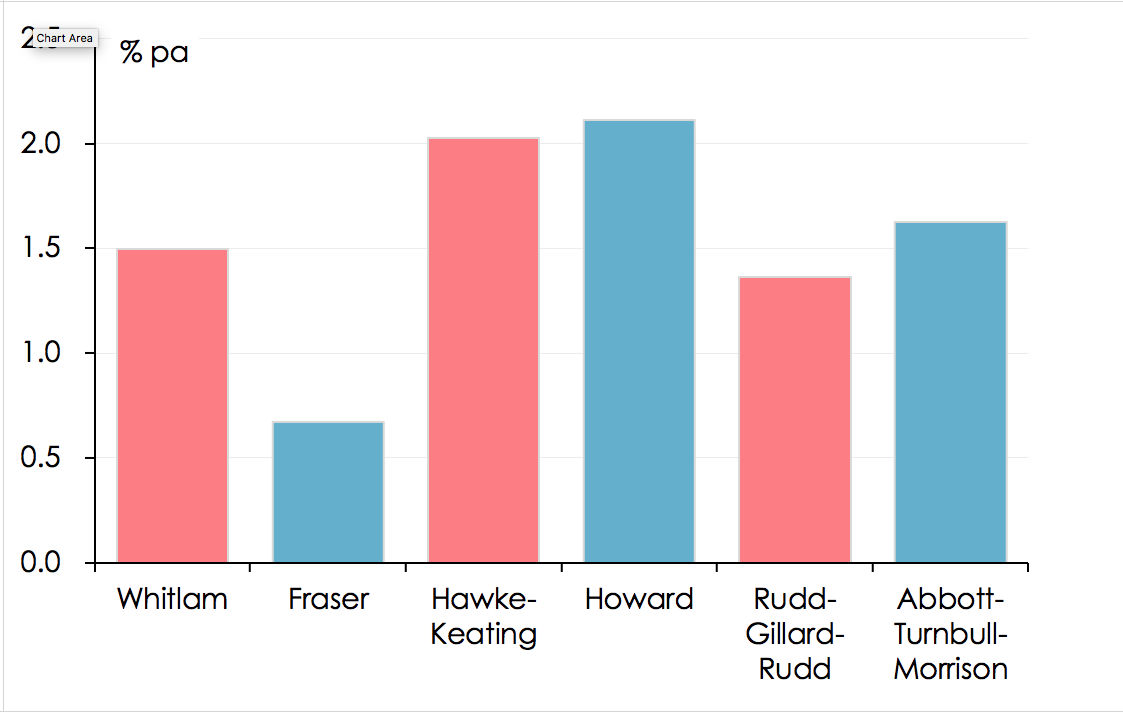
Source: ABS, Labour Force, Australia, March 2022.
Australia’s unemployment rate averaged 8.7% during the period of the Hawke-Keating Government, higher than under any other Government during the past fifty years (Chart 3). Over the past fifty years, unemployment has averaged 5.7% under Labor Governments and 6.0% under Coalition Governments: although if the Whitlam and Fraser years are excluded, the comparison becomes more favourable to the Coalition, with unemployment averaging 6.0% under the two Coalition Governments of the past 39 years and 6.9% under the two Labor Governments. That’s a reasonably significant margin: although it is perhaps also worth noting that, despite the sharp and unexpected decline over the past year, the unemployment rate under the Abbott-Turnbull-Morrison Government has averaged 5.7%, 0.6 of a percentage point higher than under the Rudd-Gillard-Rudd Government.
Chart 3: Average rates of unemployment growth under Coalition & Labor Governments
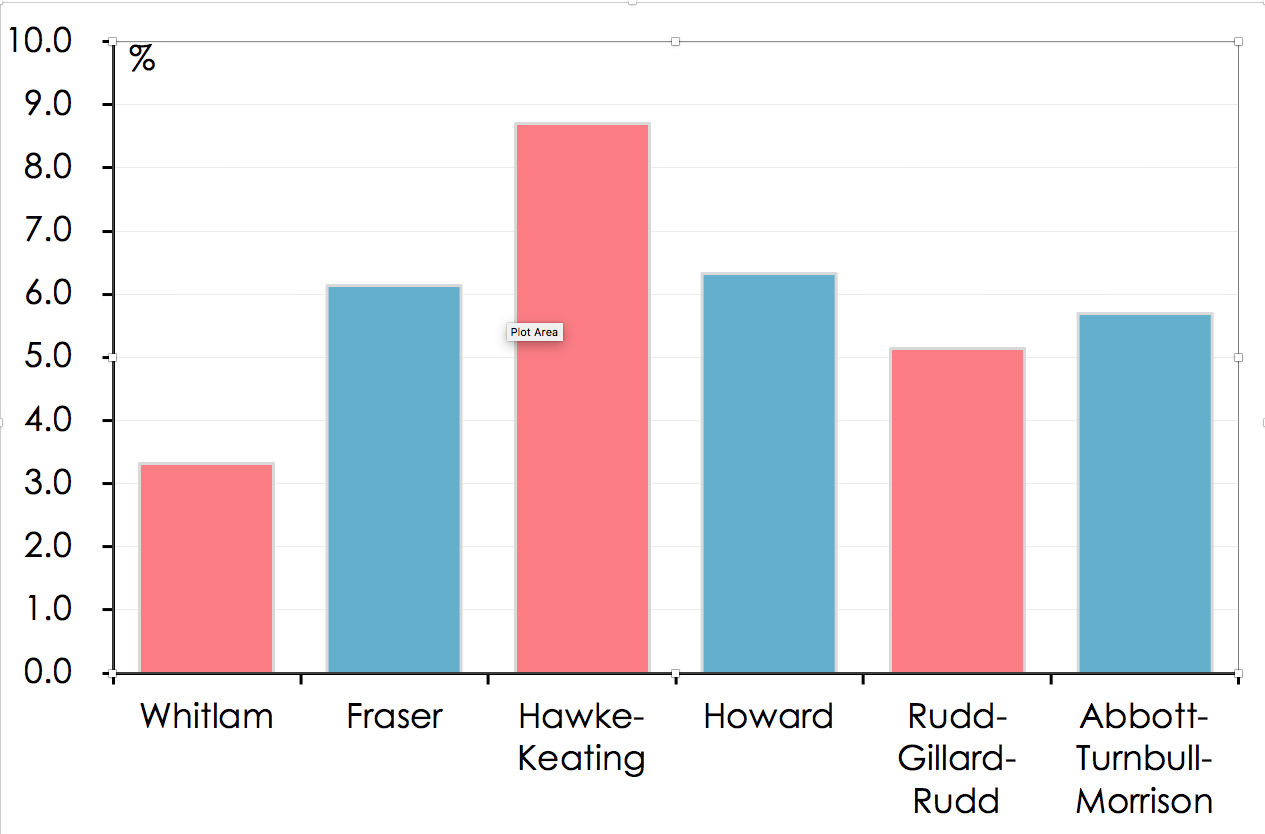
Source: ABS, Labour Force, Australia, March 2022.
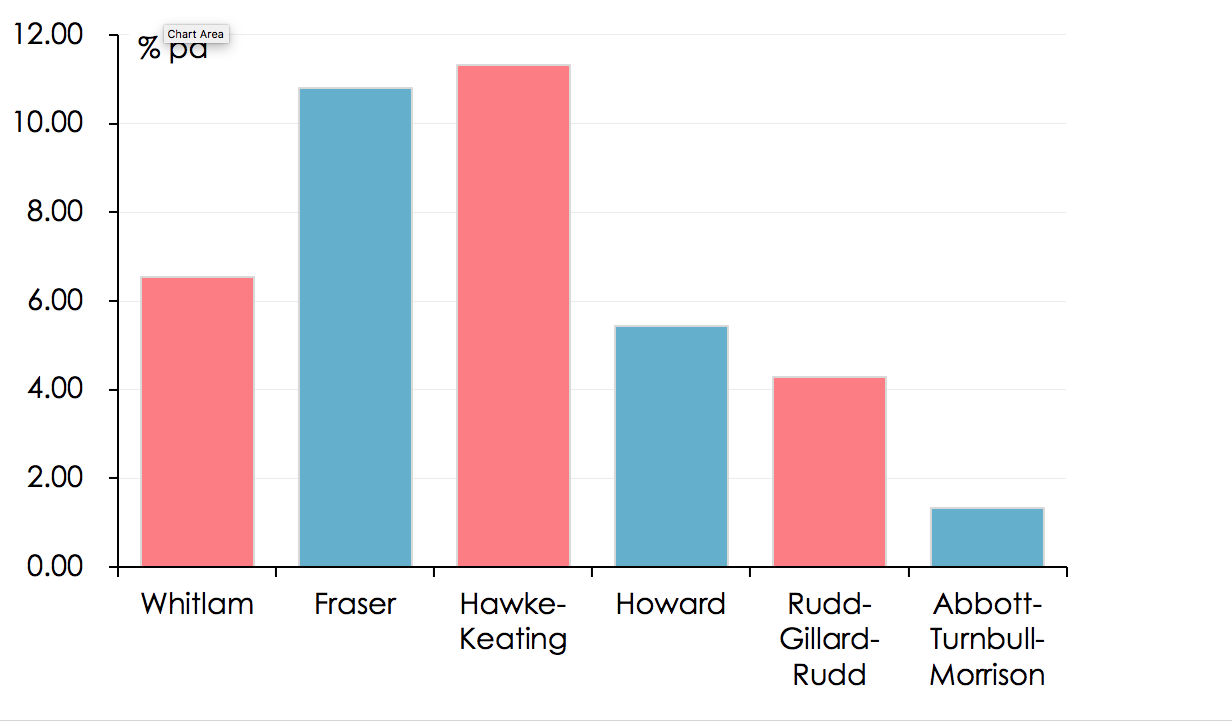
On inflation, the Coalition’s statistical record is clearly superior to Labor’s. Inflation, as measured by the consumer price index, has averaged 3.7% per annum under Coalition Governments over the past fifty years, well below the 5.8% per annum average under Labor Governments during this period (Chart 4). If the periods of the Whitlam and Fraser Governments are excluded, then inflation has averaged 2.2% per annum under Coalition Governments as opposed to 3.7% under Labor Governments.
Partly for that reason, it is also true that interest rates have been lower, on average, during Coalition Governments’ terms in office than under Labor Governments’, over both the past fifty years, and if the Whitlam and Fraser eras are excluded. The RBA’s official cash rate has averaged 7.39% under Labor Governments during the past fifty years (or 7.81% excluding the term of the Whitlam Government), and 5.87% under Coalition Governments (or 3.39% excluding the term of the Fraser Government) (Chart 4).
Chart 4: Average inflation rates under Coalition & Labor Governments

Source: ABS, Consumer Price Index, Australia, December 2021
Chart 5: Average RBA official cash rate under Coalition & Labor Governments
Source: RBA, Interest Rates and Yields – Money Market – Monthly – F1.1.
One other dimension of economic performance which is worth noting is with regard to productivity growth. Quarterly data on labour productivity only goes back to 1978, so it’s not possible to include the Whitlam and Fraser Governments in this comparison. Labour productivity growth averaged 1.8% per annum during the period of the Howard Government, which was faster than under any of the other three Governments in office over the past 39 years. However, productivity growth under the Abbott-Turnbull-Morrison Government has averaged just 1.1% per annum, which is slower than under either the Hawke-Keating or Rudd-Gillard-Rudd Governments (Chart 6). Over the entire 39-year period, labour productivity growth has averaged 1.5% under Labor Governments and 1.4% under Coalition Governments, an insignificant difference.
Chart 6: Average rates of GDP per hour growth under Coalition & Labor Governments

Source: ABS, Australian National Accounts: National Income, Expenditure and Product, December 2021.
The Coalition’s claims to be ‘superior economic managers’ also extend to their management of the nation’s finances, via the Federal Government’s Budget[2].
Here again, however, the evidence for the Coalition’s claims regarding its fiscal credentials are not wholly supported by the evidence.
The Coalition can certainly claim that its budget ‘bottom lines’ have been ‘better’, at least in an accounting sense, than Labor’s. The ‘underlying’ cash balance has been in deficit by an average of 1.0% of GDP under Coalition Governments during the past fifty years, compared with 1.4% of GDP under Labor Governments (Chart 7). The Howard Government recorded surpluses averaging 0.9% of GDP during its period in office; but the Whitlam Government also recorded surpluses (by this measure, although it wasn’t used at the time) averaging 0.1% of GDP.
The Abbott-Turnbull-Morrison Government has incurred deficits averaging 2.7% of GDP during its term in office (which of course included the Covid-19 pandemic), which is not materially different from the corresponding figure of 2.8% of GDP under the Rudd-Gillard-Rudd Government (whose term in office included the global financial crisis), but is measurably higher than the average of 1.6% of GDP under the Hawke-Keating Government.
[2] Governments’ terms in office don’t neatly co-incide with the financial years for which budget data are published. For the purposes of this article, financial years have been allocated to the terms of the Governments which were responsible for the budgets for those years. Hence the Whitlam Government is taken as ‘responsible’ for the financial years 1973-74 through 1975-76 (inclusive); the Fraser Government for the years 1976-77 through 1982-83; the Hawke-Keating Government for 1983-84 through 1985-86; the Howard Government for 1996-97 through 2007-08; the Rudd-Gillard-Rudd Government for 2008-09 through 2013-14; and the Abbott-Turnbull-Morrison Government for 2014-15 through 2021-22.
Chart 7: Average ‘underlying’ cash balance under Coalition & Labor Governments

Source: Australian Government, 2022-23 Budget Paper No. 1, Statement 10: Historical Australian Government Data, March 2022.
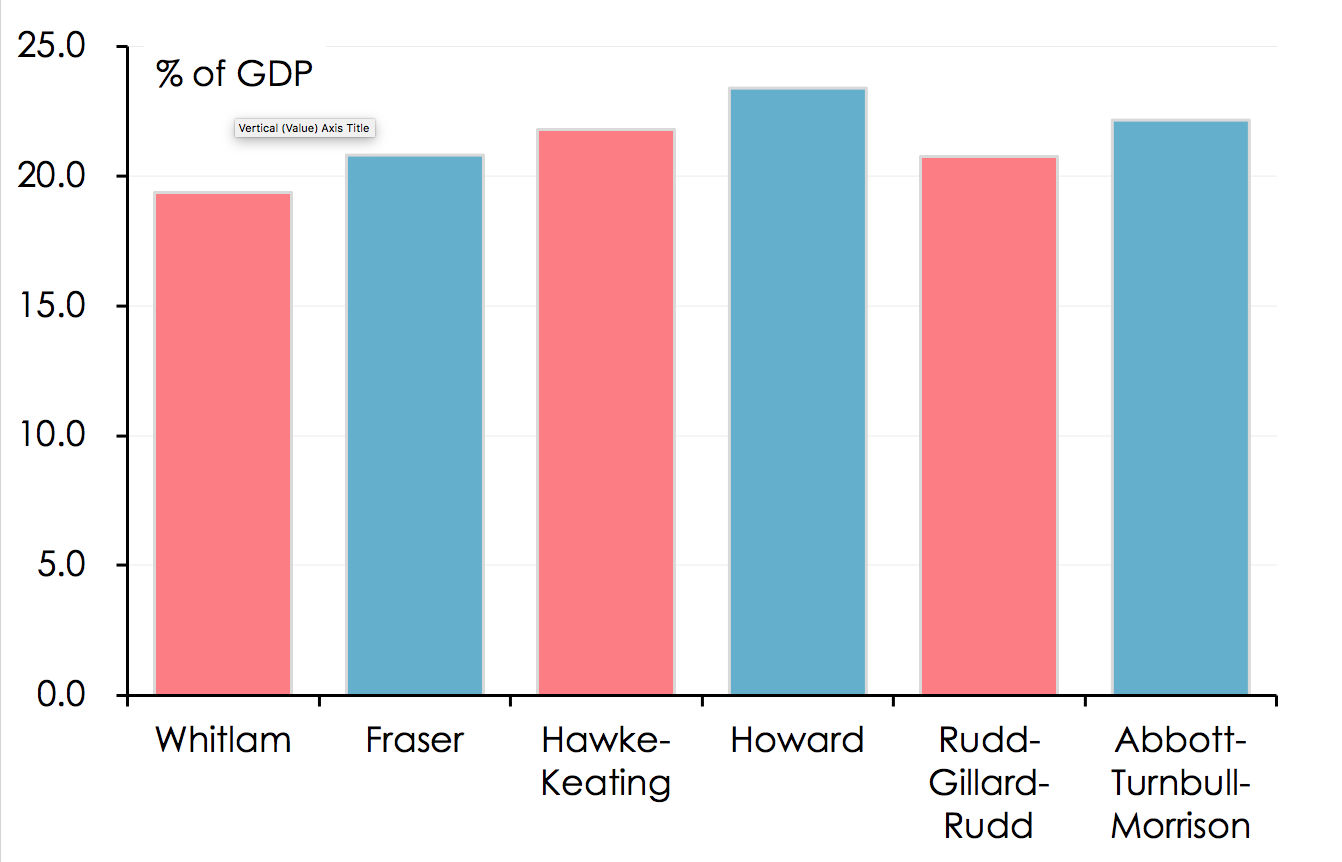
However, contrary to the Coalition’s claims, the smaller deficits incurred, on average, by Coalition Governments are not the result of lower levels of government spending than by Labor Governments. On average over the past fifty years, Australian Government ‘underlying’ cash payments have averaged 24.9% of GDP under Coalition Governments and 23.9% of GDP under Labor Governments. Excluding the Whitlam and Fraser Governments, government spending has averaged 25.2% of GDP under governments of both political persuasions.
Chart 8: Average ‘underlying’ cash payments under Coalition & Labor Governments
Source: Australian Government, 2022-23 Budget Paper No. 1, Statement 10: Historical Australian Government Data, March 2022.
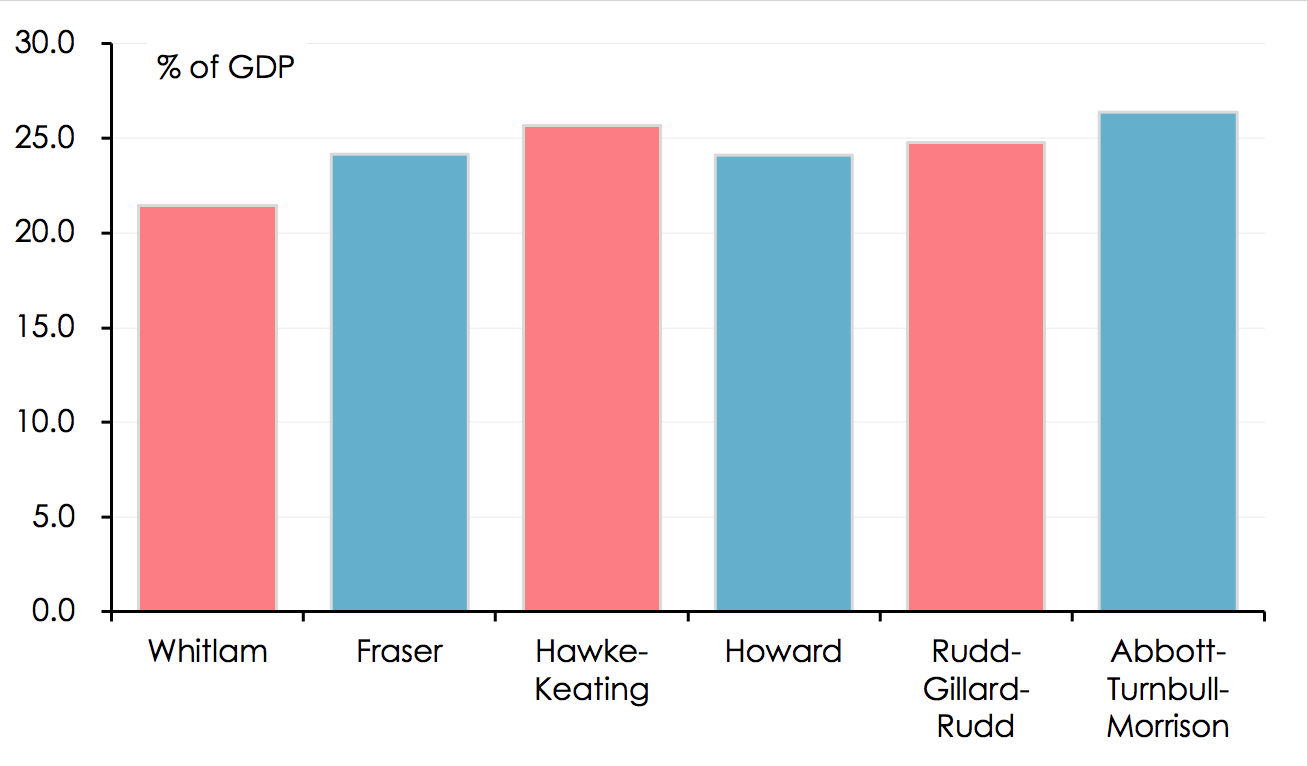
Rather, Coalition Governments have been able to run smaller budget deficits than Labor ones (or, in the case of the Howard Government, to run budget surpluses), because they have collected higher percentages of GDP in taxation than Labor Governments (Chart 9). Taxation receipts averaged 23.4% of GDP under the Howard Government, a higher percentage than under any other government during the past fifty years. On average over the past fifty years, Coalition Governments have collected an average of 22.1% of GDP in taxation, compared with 20.6% of GDP by Labor Governments. Excluding the Fraser and Whitlam Governments, Coalition Governments have collected an average of 22.8% of GDP in taxes, 1.5 percentage points of GDP more than under Labor Governments.
Chart 9: Average taxation receipts under Coalition & Labor Governments
Source: Australian Government, 2022-23 Budget Paper No. 1, Statement 10: Historical Australian Government Data, March 2022.
That’s not to say that running budget deficits is evidence of ‘poor economic management’ – there are circumstances, such as during the global financial crisis and the Covid-19 pandemic – when running deficits is absolutely the Right And Proper Thing To Do. Similarly, there is nothing necessarily wrong with paying for higher levels of government spending with higher levels of taxation, or raising taxes in order to reduce budget deficits in circumstances when deficits aren’t appropriate. But the Coalition’s claim not to have done either of those things – or to have done them to a lesser extent than Labor – aren’t supported by the available evidence.
Do the numbers tell us all we need to know?
Purely in terms of ‘numbers’, the Coalition can legitimately claim to have a better record than Labor on inflation and interest rates over the past fifty years, and a better record with regard to unemployment, at least under the Howard Government. However ‘the numbers’ do not lend any support to suggestions that Coalition Governments have presided over faster economic, employment or productivity growth than Labor Governments: and they flatly contradict Coalition assertions that taxes are always lower under Coalition Governments than Labor ones.
However, the idea that Governments are entitled to claim the credit for, or deserve to be blamed for, everything that happens to every set of economic or fiscal data on their watch defies economic theory, history, common sense and logic.
First, although Australia may be an island, the Australian economy is not ‘entire and of itself’. As a ‘small open economy’, it is inevitably affected by global trends and cycles in economic growth, interest and exchange rates, and commodity prices which are determined in global, not domestic, markets. So is the Australian Government’s budget.
Second, economic variables such as economic and employment growth, inflation and interest rates respond to international economic developments, and to both international and domestic economic policy decisions, with lags. The effects of decisions made by a particular government can, and often do, show up during the terms of their successors, rather than disappearing entirely when the government changes.
Third, governments inherit economic circumstances from their predecessors (and bequeath them to their successors). A government which inherits a high unemployment rate or a high inflation rate from its predecessor may end up with a higher average unemployment or inflation rate than its predecessor and/or its successor even if, objectively, it does a ‘good job’ in lowering unemployment or inflation.
So it is important, in assessing claims to ‘superior’ economic or fiscal management, to look at the context in which governments have operated, rather than looking only at ‘the numbers’.
The Coalition’s ‘record’ as indicated by the ‘numbers’ presented here has been materially assisted by three developments in particular over which it had no control and for which it can claim no credit.
The first of these is the extraordinary surge in commodity prices which occurred during the term of the Howard Government, largely as a result of the rapid economic growth and industrialization in China which had begun well before the Howard Government came to office, but which reached something of a ‘tipping point’ (as far as the volume and prices of Australian exports were concerned) during its tenure.
Australia’s ‘terms of trade’ – the ratio of the prices received for Australia’s exports of goods and services relative to the prices paid for Australia’s imports – rose by 55.3% over the life of the Howard Government (Chart 10). This amounted to a transfer of income from the rest of the world to Australia equivalent to an additional 0.7 percentage points per annum of GDP during the Howard Government’s period in office, over and above the measured rate of real GDP. The spending of those ‘windfall’ income gains boosted recorded real GDP growth: while the tax payable on those ‘windfall’ gains (especially that part of it which accrued to companies) contributed to the elevated level of tax collections as a proportion of GDP under the Howard Government (and enabled it to both run budget surpluses and offer repeated rounds of personal income tax cuts and expanded cash benefits).
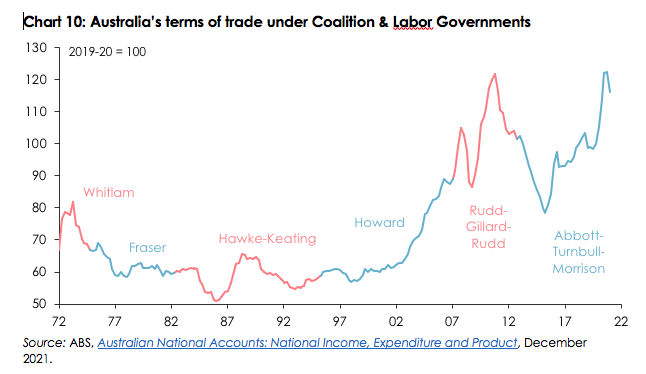
Smaller terms-of-trade gains under the Rudd-Gillard-Rudd and Abbott-Turnbull-Morrison Governments (of 11.0% and 14.3%, respectively) provided ‘windfall’ income gains equivalent to an additional 0.6 and 0.3 percentage points per annum, respectively, under those governments – although there was proportionately less of a ‘dividend’ in terms of tax collections for those governments because, by then, resources companies were undertaking much higher levels of capital expenditures (entitling them to a range of tax deductions) than they were during the Howard Government’s term in office.
None of these governments of course did anything to procure these terms-of-trade gains – from Australia’s perspective they were the equivalent of ‘manna from heaven’, something which should be borne in mind when interpreting the ‘numbers’ recorded during their time in office.
By contrast, Australia’s terms of trade declined during the tenures of the Whitlam, Fraser and Hawke-Keating Governments – in each case detracting the equivalent of 0.2 percentage points per annum from the income accruing from the growth in real GDP.
The second important set of developments which exerted important influences on the performance of the Australian economy over the past fifty years, but over which governments had little or no control, concerns the behaviour of the exchange rate.
All else being equal, a lower exchange rate boosts real GDP and national income (measured in Australian dollars) by making exports more competitive (and increasing the income, in Australian dollars, of any given amount of foreign currency income) whilst simultaneously making imports less competitive (and thus boosting domestic production of goods and services which compete with imports).
The performance of the Australian economy during the Howard Government’s term in office was thus materially aided by the fact that the exchange rate for the A$ averaged US68 cents during its term in office, lower than under any other government in the past fifty years (Chart 11).
Conversely, the economy’s performance under the Rudd-Gillard-Rudd Government was adversely affected by the fact the Australian dollar was much stronger during its term in office, averaging 93.4 cents and exceeding parity with the US dollar for more than one-third of its tenure. Among other things that offset some of the gains otherwise accruing from the elevated terms of trade at that time. The Abbott-Turnbull-Morrison Government’s record, on the other hand, has been enhanced by an exchange rate averaging US76 cents since it came to office, even though Australia’s terms of trade have not been appreciably lower, on average, than they were under the Rudd-Gillard-Rudd Government.

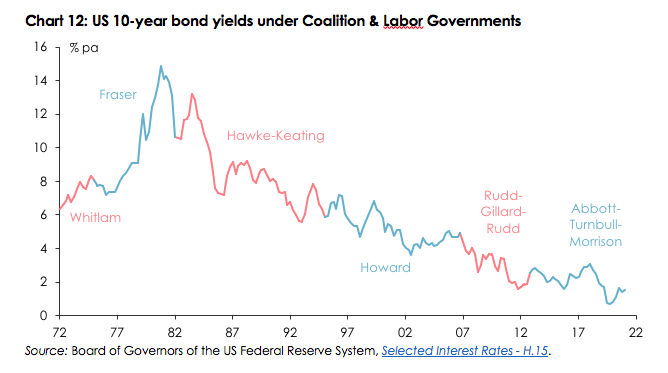
Finally, the trend decline in Australian inflation and interest rates over the past thirty years – during most of which Coalition Governments were in office – owes a good deal to the contemporaneous downward trends in global inflation and interest rates over this period – as illustrated by the steady decline in US 10-year government bond yields depicted in Chart 12. The decline in global longer-term interest rates has also been a factor in the gains in asset values (including both property and share prices) over this period, which have boosted personal wealth and, indirectly, economic growth.
However, while these downward trends in global inflation and interest rates during a period in which the Coalition has been in office more than Labor have contributed to the Coalition’s numerically superior record with regard to Australian inflation and interest rates, they are not something for which the Coalition can legitimately claim any credit.
In addition to these international influences over which no Australian Government, no matter how competent (or incompetent), has any control, what happens to economic variables under any particular government is likely to be shaped, in part, by trends carrying over from its predecessor, and from policies implemented by its predecessor.
Thus for example, the Australian economy’s performance under the Howard Government was enhanced by reforms implemented by the Hawke and Keating Governments, as John Howard has himself readily acknowledged. The Rudd-Gillard Government’s ability to respond forcefully to the global financial crisis – and in particular, to ward off the threat of recession – was enhanced by strong fiscal position bequeathed to it by the Howard Government.
Conclusion
The reality is that neither of the major parties can reasonably claim to be ‘better economic managers’ than the other, once account is taken not merely of the raw numerical indicators of different aspects of the performance of the Australian economy while each has been in office, but also of the various ‘headwinds’ and ‘tailwinds’ arising from international and other factors beyond the control of any Australian government, and of the legacies bequeathed from one government to the next.
In any event, political parties’ claims to superior performance in any area of public policy ought to be subject to the same disclaimer as one typically finds in the fine print of the promotional material distributed by funds managers: “past performance is no guarantee of future returns”.
The economic policy challenges facing which ever party (or parties) who form Australia’s next government are likely to be different from those which have confronted governments over the past decade.
Those challenges will likely include – not necessarily in order of importance – steadily slowing growth in (as well as increasingly fraught bilateral relationships with) our largest trading partner, China; partly in consequence of that, falling terms of trade; further ‘de-globalization’ of the world economy with an attendant risk of more persistent inflation; rising global and domestic interest rates; and climate change.
And some other, long-standing, economic policy challenges may become more urgent – including Australia’s poor productivity growth performance (admittedly not a problem unique to Australia); on-going stagnation in real wages (which, as RBA Governor Philip Lowe has observed, is “diminishing our sense of shared prosperity”); the seemingly inexorable deterioration in housing affordability and home ownership rates (which, when the results of the 2021 Census are released, are likely to have fallen to their lowest since the Census of 1954, and for younger age groups, the lowest since the Census of 1947); and how best to raise the additional revenue required to fund the additional government spending (to the tune of almost 2 percentage points of GDP) which the most recent Budget Papers recognize as being “baked in” over the next decade, compared with the medium-term projections issued before the pandemic.
Ideally, the contest over who has the better ‘economic management credentials’ would be one in which each party set out how they proposed to respond to each of these challenges (or others which they identified as being no less important), and in which each sought to demonstrate why they were more capable of delivering effective responses to those challenges than their opponents.
But we don’t live in an ideal world.


Saul Eslake worked as an economist in the Australian financial markets for more than 25 years, including as Chief Economist at McIntosh Securities (a stockbroking firm) in the late 1980s, Chief Economist (International) at National Mutual Funds Management in the early 1990s, as Chief Economist at the Australia & New Zealand Banking Group (ANZ) from 1995 to 2009, and as Chief Economist (Australia & New Zealand) for Bank of America Merrill Lynch from 2011 until June 2015.

Contributions to Pearls and Irritations
Your contribution will fund quality independent comment and analysis in Pearls and Irritations
Contribute