Environment: Murray-Darling Plan delivers profits, but not environmental improvement
June 22, 2025
Murray-Darling Plan has achieved five of seven economic goals but only 2 of 12 environmental ones. Will climate change be good or bad for the economy? Nations’ current emissions reduction policies unlikely to keep global warming under 2oC.
Murray-Darling Basin Plan fails to deliver environmental improvements
If you are feeling a bit down about the state of Australia’s natural environment and the abject failure of federal and state governments of both persuasions to do anything to improve matters (whether through ignorance, incompetence or corruption), I suggest you delay reading this piece until you are feeling more robust.
The Murray-Darling Basin extends over one million km2 (14% of Australia) and covers the country of 41 Indigenous nations. It contains more than 30,000 wetlands that support many species of plants, freshwater fishes, birds and other animals. The Basin provides water to 2.2 million people and the farms that generate 40% of the value of Australia’s irrigated agricultural production. As is well known, the Basin, the rivers within it and the associated ecosystems have suffered enormously from neglect, pollution and over-extraction of water for decades, and the destruction continues.
The Murray-Darling Basin Plan, “one of the most ambitious water-reform programs ever attempted”, was developed by the governments of Australia, Queensland, NSW, Victora, South Australia and the ACT in 2012 with the objective of redressing the imbalance between consumption and the environment by reducing water diversions to irrigators and returning it to the environment. The Murray-Darling Basin Authority has responsibility for implementing the Plan.
More than a decade later, there was “still no rigorous, transparent, accountable system for monitoring, evaluating and reporting” the Plan’s achievements. Consequently, a team of independent researchers developed a reporting framework of 27 indicators to assess the outcomes using publicly available data (unfortunately, often of poor quality). The indicators are arranged into five themes: environmental (12 indicators), economic (7), social (3), compliance and enforcement (3), and Indigenous (2). This is where we get to the depressing bit.
Only two of the environmental indicators were met: reductions in nitrogen and phosphorous pollution and improvements in the populations of large-bodied fish. Indicators relating to the condition of Ramsar wetlands, river flows, waterbird abundance, number of fish kills, discharge of salt from the Murray River mouth and times when the mouth was naturally open all declined. Three indicators had variable outcomes but no overall success.
None of the Indigenous, social or compliance and enforcement indicators were met.
The only consistent winner was the economic theme where five of the indicators were met: steady or improving personal incomes and steady or reduced disparity in incomes in the Basin; steady or improving value of irrigated agricultural production, overall and per unit of irrigated water; and improving farmland price.
The authors conclude: “Despite $13 billion committed to water reforms, trends of most indicators (74%) show no improvement or are worsening. Our results support the finding that ‘irrigators came out of each subsequent stage of the reform process better placed than the environment’.” Never let it be said that politicians, public servants and capitalists don’t know how to devise and exploit a gameable system.
The authors propose relatively simple and cheap improvements for each of the indicator themes. They also make the outrageous suggestion that improved co-ordination between Commonwealth, state and territory agencies would be helpful.
Climate change will, maybe, perhaps, just might damage the economy
Caveat emptor: the main benefit of reading this piece is that you will know that you are not alone in your ignorance.
There is a smallish group of economists around the world who have been trying to calculate the economic impact of climate change, for instance its effects on global and national GDP. One reason for having some understanding of the economic cost of climate change (of not doing enough and not quickly enough to halt it) is that it potentially facilitates an evidence-based rebuttal of the oft-made claim that climate action is unnecessary, unjustifiable or unaffordable (the approach being taken by Team Trump).
Another reason is that knowing the economic cost of climate change underpins the social cost of carbon (the cost of responding to the environmental, health and social damages caused by climate change) and this determines the optimal rate of greenhouse gas emissions reduction.
Unfortunately, the research that has been conducted on the cost of climate change has not produced very useful results. For instance, findings do not agree even on whether climate change will have positive or negative effects on the economy, and estimates of the size of any economic cost or benefit have often had very wide confidence intervals.
Richard Tol, one of the doyens of this topic, has attempted to move the debate forward by conducting a new meta-analysis of all 39 studies known to him that have examined the issue. The methods and results are far too complex and arcane for me to summarise in any detail so I will limit myself to the headlines:
- Published estimates of the economic effects of global warming vary widely in both magnitude and direction;
- This meta-analysis shows the central estimate of the economic impact of global warming is always negative (i.e., various ways of computing the average of the various estimates always indicates a cost not a benefit) but …
- … the confidence intervals around the central estimates are too wide to put much confidence in them;
- Studies that examine the actual temperature predict a permanent effect on the economy, but studies that examine temperature change predict a temporary effect;
- One methodological approach to measuring the impact produces the most pessimistic (costly) estimates; a different approach produces mostly optimistic (beneficial) estimates;
- While both positive and negative surprises are possible at any degree of warming, the negative surprises are larger than the positive ones;
- Published estimates of the social cost of carbon vary enormously, from a positive benefit of US$587 per ton of carbon to a negative cost of US$355 per ton. Different methods of calculating the average social cost of carbon produced results varying from US$1 to US$218 per ton, with most falling in the US$17 to US$87 range;
- Poorer countries and hotter countries are more vulnerable to the economic impacts of climate change than richer and cooler ones.
That said, if you want a single takeaway message, at 2.5oC of global warming, the “average global person” (yes, I know, but let’s move on) would have lost 1.7% of their income compared with had there been no warming. But in the majority of countries, the loss will be larger than this.
Feel free to make what you will of all that. To quote Tol, “The more we learn about the economic impacts of climate change, the better we understand our ignorance”. That’s good, although, generally speaking, I’ve seldom noticed any shortage of people eager to help me understand my ignorance.
Greenhouse gases in a nutshell
Two figures and a table from the UN present a clear simple picture of the sources of greenhouse gases, the threats they pose and the potential to reduce them.
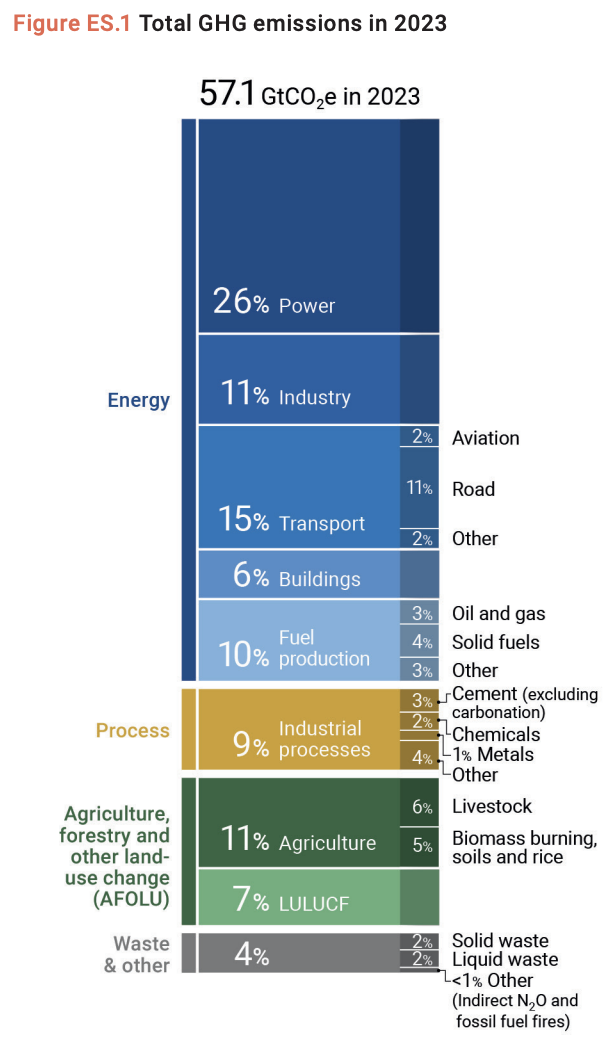
Where do they originate? More than two-thirds (68%) of the 57 billion tonnes of CO2 equivalent (GtCO2e) greenhouse gases (GHGs) emitted into the atmosphere around the globe during 2023 were associated with the production of energy. The land produced 18%.
What are the risks? Bearing in mind the history of climate negotiations over the last 30 years, and the extant (rather than rhetorical) enthusiasm of governments of high emitting nations to rapidly eliminate their emissions (emissions rose by 1.3% in 2023), there is to all intents and purposes no likelihood of keeping global warming under 1.5oC (table below). Staying under 2oC is highly unlikely and there’s a credible chance of warming exceeding 3oC.
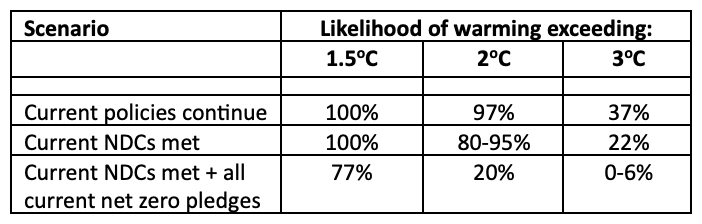
NDCs: Nationally Determined Contributions
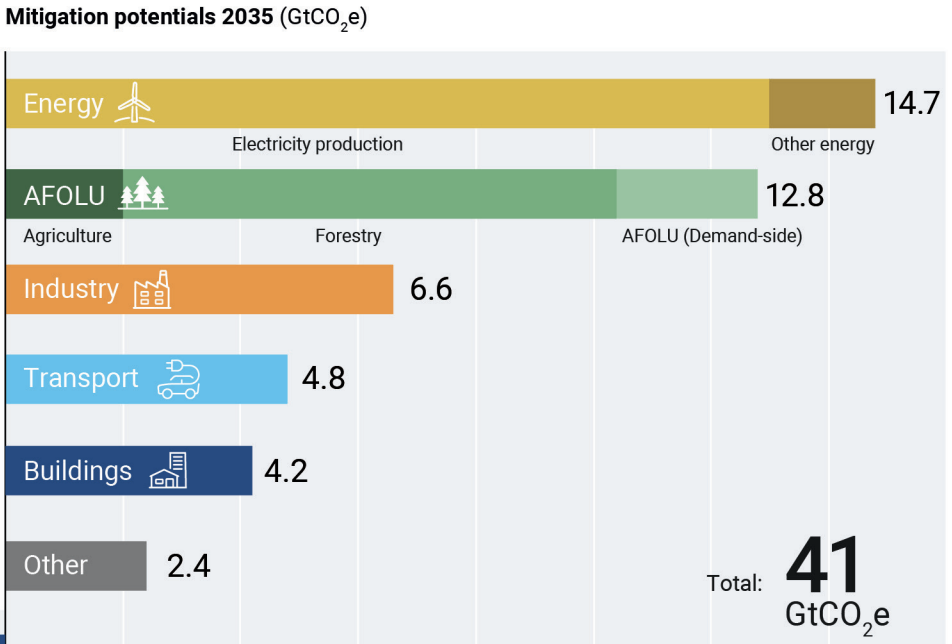
How can emissions be reduced? In the unlikely event that governments suddenly get serious about reducing their GHG emissions, they could reduce emissions by 41 GtCO2e per year over the next decade by focusing their attention on the emissions associated with energy production (particularly electricity), the land (particularly reducing deforestation and increasing reforestation) and industry (see bar chart below). Increased energy efficiency and electrification will also reduce emissions in the industry, transport and building sectors. All the interventions needed to achieve these emissions reductions are available at less than US$200 per ton of CO2e.
Your guide to the social cost of carbon
Returning to economics, I can’t resist teasing you all with the figure below which Tol asserts “presents our best knowledge on the economic impacts of climate change. Warts and all, it should be used to estimate the social cost of carbon and inform the optimal rate of emission reduction”.
Send your best estimate of the social cost of carbon in an email to me before Armageddon occurs. Please enclose stamped, self-addressed envelope.
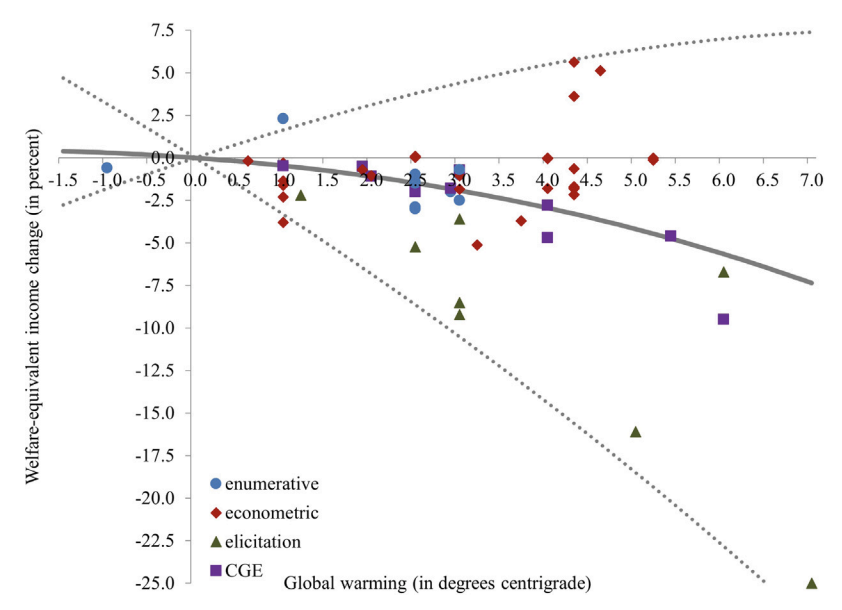
Figure 1. The impact of climate change since pre-industrial times on global welfare, according to comparative static studies. Primary estimates are shown as dots. The central, solid line is the Bayesian model average, the dashed lines the central estimate plus or minus twice the estimated standard deviation.
The views expressed in this article may or may not reflect those of Pearls and Irritations.