
Economic reform and the productivity slowdown
August 16, 2025
The productivity slowdown is mostly due to slower technological progress. The economic reform agenda should focus on measures to improve competitive pressures for firms to innovate and improve.
Fundamentally the rise in our living standards is determined almost entirely by the rate of increase in productivity. As the leading American economist, Paul Krugman, famously said: “While productivity is not everything, it is almost everything”.
But recently, productivity growth has slowed down substantially, and in 2024 labour productivity in Australia was still lower than it was pre-COVID in 2019 (see Table 1). This slowdown has now led the Reserve Bank to lower its forecast for future productivity growth by 0.3 percentage points from an annual rate of growth of 1% to 0.7%; much less than the annual average rate of productivity growth of 1.6% over the last 60 years.
No wonder that the Treasurer wants the focus of his Economic Reform Roundtable to be on productivity. But while lots of (largely self-interested) proposals have been put on the table, it is not clear how much difference — if any — they will make to future productivity growth.
Instead, we need to assess this host of proposals based on an analysis of why productivity growth has slowed. And this analysis should begin by recognising that throughout history productivity growth has been almost entirely driven by technological change.
Indeed, the significance of technological change for productivity is supported by the fact that productivity growth has slowed everywhere in the developed world. The advanced economies of the world tend to use much the same technologies and have much the same rate of take-up, with variations at the margin. A slowdown in the rate of technological innovation is therefore the obvious reason why productivity growth has slowed in all these countries by much the same amount over the last 15 years.
Table 1 Labour Productivity Growth
Average annual percentage change %
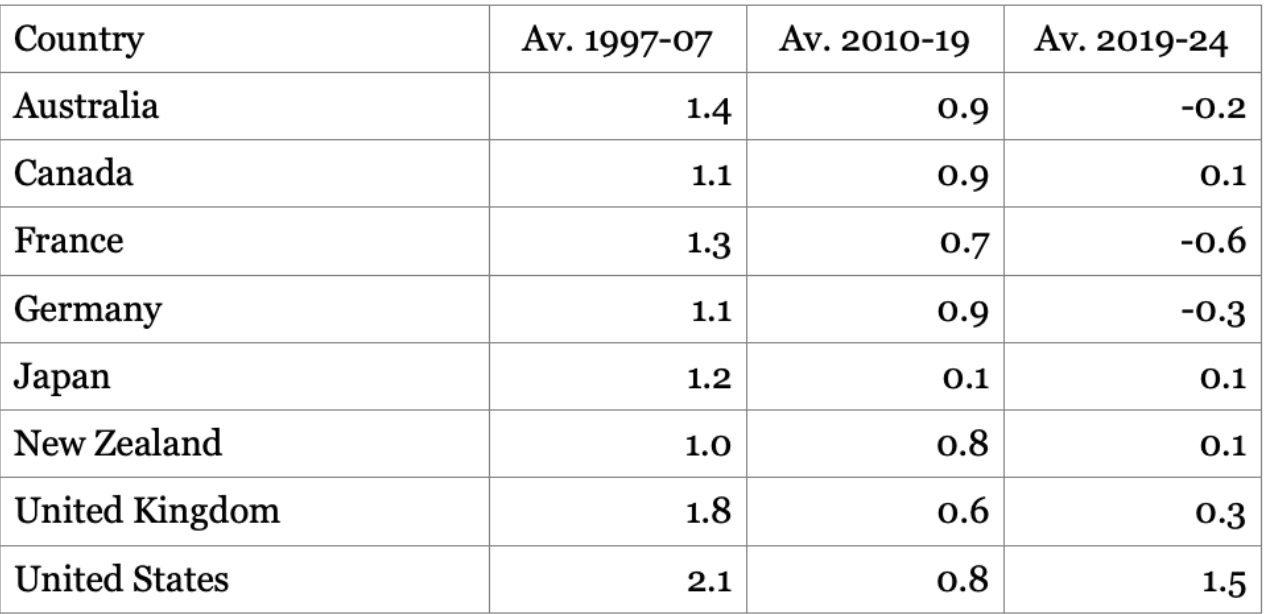
As is evident in Table 1, productivity growth was markedly lower in each of these developed economies in the decade before COVID, than it was in the decade prior to the Global Financial Crisis. In addition, productivity growth has stagnated in each of these countries, except for the US, since the outbreak of the COVID pandemic. The US exception may be due to its leadership in the latest technology, such as AI.
But before considering further what can be done to accelerate Australia’s rate of adoption of technological change, it is worth noting some of the productivity slowdown comes from structural factors.
First, in Australia labour productivity in mining is more than 10 times higher than the average for all other industries combined – reflecting the fact that it is highly capital-intensive. But Australia’s productivity slowdown coincides with the end of the mining boom more than a decade ago, and in recent years the productivity in the resource industries has actually been falling.
Second, the service industries are all labour-intensive and have levels of labour productivity which are typically well below the average.
Further, the independent economist, Saul Eslake, has shown that the share of low productivity industries has increased from 40% to 46% of total hours worked over the last 20 years, and that would help explain part of the slower productivity growth for the economy as a whole.
Another part of Australia’s overall poor productivity performance reflects the fact that productivity is hard to measure in many of these service industries – for example, if school class sizes are reduced is that a loss in productivity? In addition, the expansion of many services in healthcare and education may well add more to our well-being than an expansion of coal and gas mining, but that is not reflected in the estimates of labour productivity.
The slowdown in productivity growth for these reasons does not suggest the need for a policy response. The relatively rapid growth in services is not something that a government can control easily and may not want to. On the other hand, policy can make a difference to the rate of take-up of new technologies which, as previously noted, are the principal driver of productivity growth.
Recent research by the OECD and the Treasury suggests that the rate of diffusion of technological change has slowed and that this is an important part of the productivity slowdown. According to the Treasury: “Progress at the technological frontier has remained strong, while the gap between firms at the global frontier and other ‘laggards’ within an industry has grown."
Treasury further found that, “Consistent with overseas evidence, … the gap between global frontier firms and Australian firms has grown over time in the non-resource, non-financial market sector. Moreover, Australian firms catch up to the global frontier more slowly than previously, suggesting slower adoption of cutting-edge technologies and processes".
This “slowdown has been more notable in industries with declining measures of dynamism and competitive pressures, suggesting the slowdown may reflect weaker incentives and imperatives to improve”. Treasury therefore concluded that “policies to address business dynamism and competitive pressures can improve Australia’s productivity performance, by increasing incentives for firms to adopt, innovate and improve”.
Personally, I agree with the Treasury. But what I also find interesting is that taxation is not mentioned. While tax incentives to invest can help accelerate the adoption of new technologies, I doubt they will achieve much if demand for the products from that investment and the rate of capital utilisation are low.
Further, the data showing the ratio of government revenue to GDP in Table 2 show that Australia is a low-tax country compared to all the other main developed economies, except the US. Also, the only reason that the US has a lower ratio of tax revenue to GDP than Australia is because the US has a much bigger budget deficit.
Table 2 Government Revenue as percent of GDP
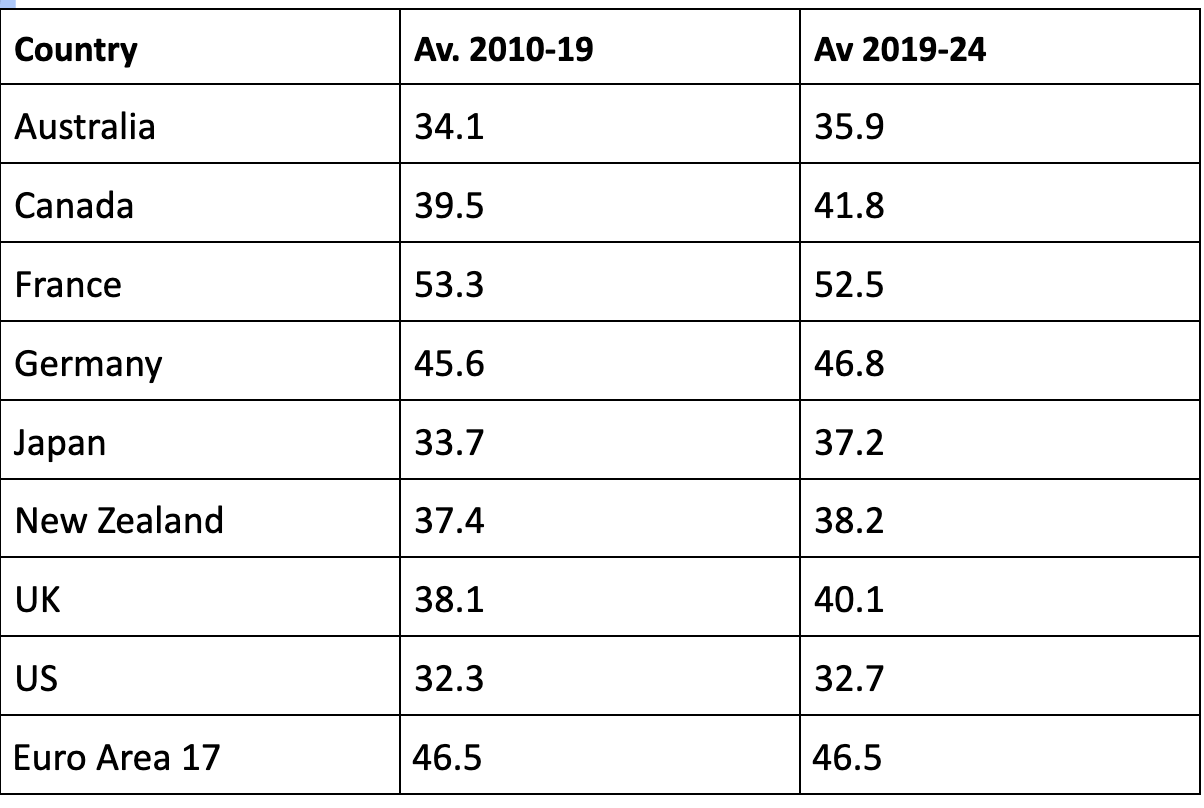
In sum, the data show no correlation between the amount of taxation in Table 2 and the rate of productivity growth in Table 1, nor with the rate of innovation. Instead, it may be that the way the tax revenue raised is spent on education, skills and research, for instance, will make more difference to productivity growth.
The views expressed in this article may or may not reflect those of Pearls and Irritations.

