Environment: Australian Government misleading people about our emissions reductions
September 7, 2025
Ignore the government rhetoric, Australia’s actual emissions are not falling. NSW Forestry Corporation facing 29 charges of illegal logging. Swift parrot habitat continues to be logged in three states. Trump swimming against the energy tide.
Australia’s GHG emissions are not falling
According to the quarterly report issued by the Australian Department of Climate Change, Energy, the Environment and Water (DCCEEW) in May 2025, Australia’s annual greenhouse gas emissions in the year to December 2024 were 446 million tonnes of CO2 equivalent (Mt CO2-e) – a marginal increase on the previous year. Nevertheless, the Department likes to highlight that the current level of emissions represents a decrease of 27% compared with the year to June 2005 (the internationally agreed baseline year for comparisons). DCCEEW also likes to imply that Australia is on track to meet its Paris Agreement commitment: “Australia is 45% of the way through the Paris Agreement target period and has used 45% of the emissions budget to 2030.” That doesn’t sound too bad, does it?
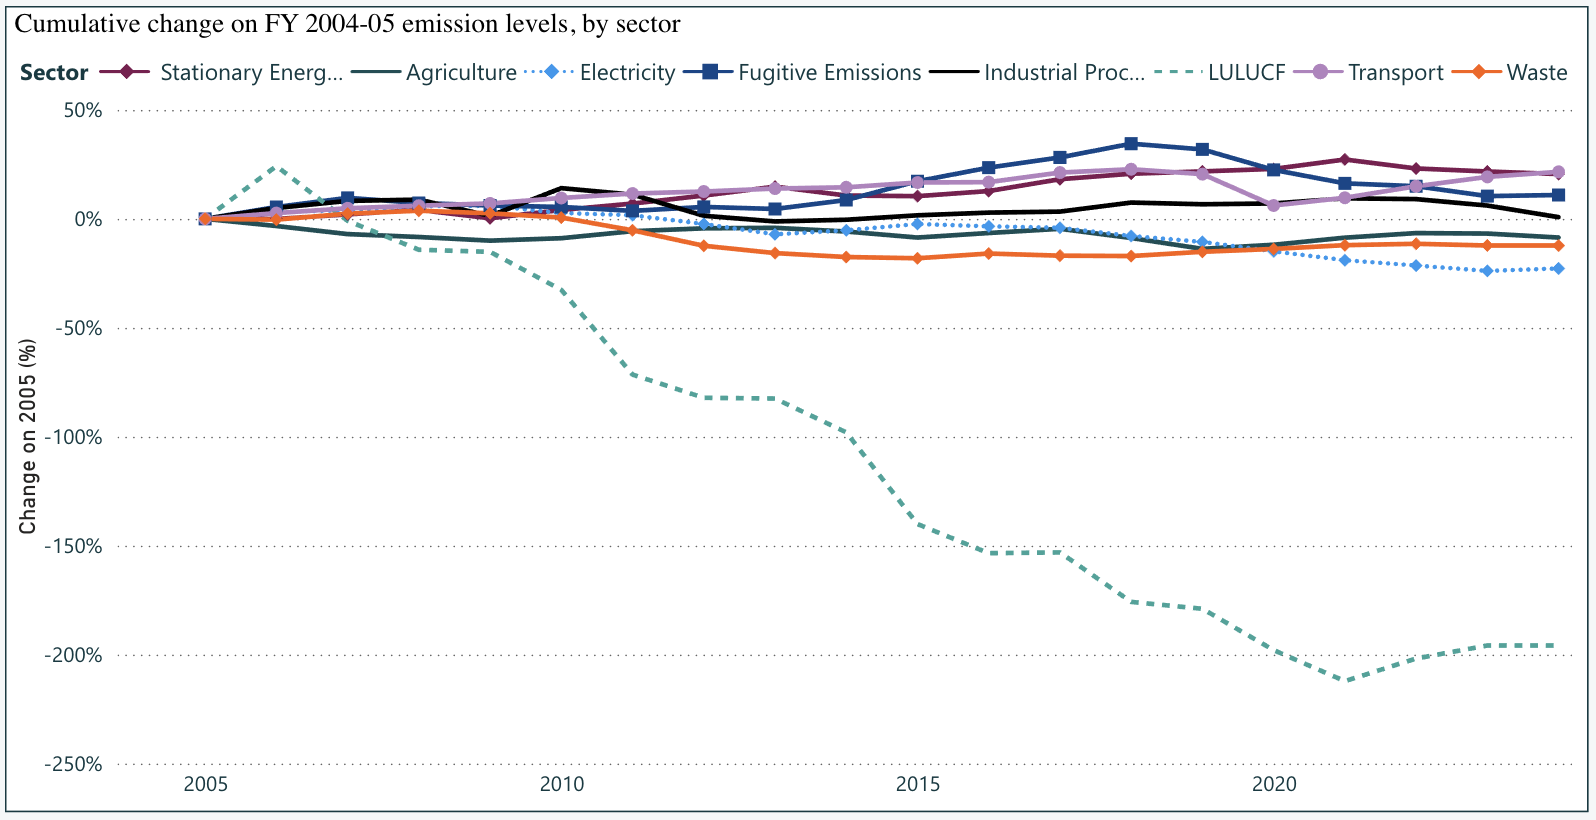
Dig a little deeper into the report though and the picture isn’t quite so rosy. The graph below shows the cumulative change in Australia’s total GHG emissions by sector between 2005 and 2024. Two features stand out:
- There has been little change in the annual emissions of all but one sector of the economy over the 20 years. Among the slow movers, the electricity sector oversaw the biggest decrease in both percentage terms (23% overall – slightly more than 1% per year) and absolute numbers (approximately 45 Mt CO2-e/year).
- Emissions attributable to Land Use, Land Use Change and Forestry have fallen by 196% during the period. In 2015, LULUCF in Australia transitioned from being a net source to a net sink of GHG emissions. Instead of emitting approximately 75 Mt CO2-e/year in 2005, the sector absorbed approximately 75 Mt CO2-e/year in 2025.
The changes in the quarterly emissions of each sector over the last twenty years are displayed in the table below.
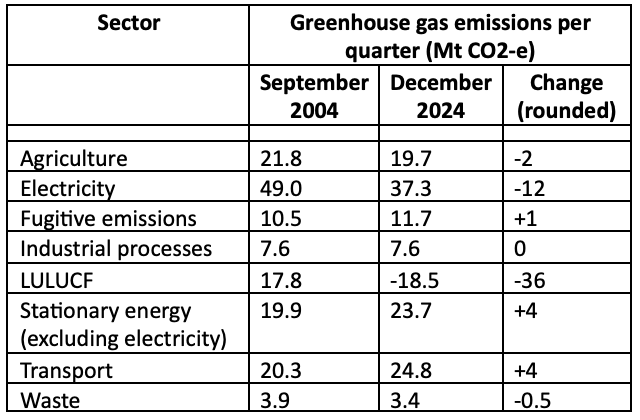
Much as Labor ministers are just as keen as Coalition ministers to tell Australians and the world that we’re making good inroads into our domestic GHG emissions, the simple fact is that were it not for the changes in the land use sector (which may reflect Australia’s shenanigans during the Kyoto Protocol negotiations as much as actual emissions reductions), Australia would be struggling to demonstrate any improvement over the last two decades. In fact, LULUCF aside, Australia’s actual emissions have decreased by only approximately 20 Mt CO2-e/year (4%) since 2005, an average of 0.2%/year. A mighty achievement indeed; both major parties have had more success at reducing their primary vote.
Fundamentally, the current Australian Government has three climate change strategies:
- Roll out renewable energy within Australia;
- Keep exporting fossil fuels for as long as possible; and
- Make token contributions to helping Pacific nations cope with the effects of climate change.
None of these strategies is focused on the absolute imperative: reducing our own and global GHG emissions as rapidly as possible.
NSW EPA charges NSW Forestry with illegal logging
In September 2023, I described how speedy action by Wilderness Australia, WWF and hundreds of concerned citizens led to the NSW Environmental Protection Authority issuing the first of a series of Stop Work Orders to prevent the state-owned Forestry Corporation of NSW logging the old growth, native forests of the Tallaganda State Forest (the link has great photos of the natural forest and the destruction caused by FCNSW). The Tallaganda is one of the few remaining strongholds of the nationally endangered Greater glider. In February 2024, I was delighted to report that FCNSW had abandoned their then current plans to log the forest.
I am now ecstatic to advise that the EPA has filed 29 charges against FCNSW in the Land and Environment Court for illegal logging in the Tallaganda State Forest. Most of the charges relate to the Forestry Corporation’s failure to conduct, as they are required to do, competent surveys of Greater glider den sites and destruction of Greater glider habitat. If found guilty (their defence will be interesting to hear), the Corporation could receive a penalty in the millions.
How absolutely ridiculous is this situation! What a waste of taxpayers’ money. One NSW Government agency has been obliged to charge another NSW Government agency (one that requires government subsidies to remain operational) with illegally logging old growth trees that provide habitat for a threatened animal species in a state forest. Guilt or innocence will be determined by another branch of the NSW Government. What a dreadful waste of public time and money. The NSW Labor Government should be thoroughly ashamed of itself.
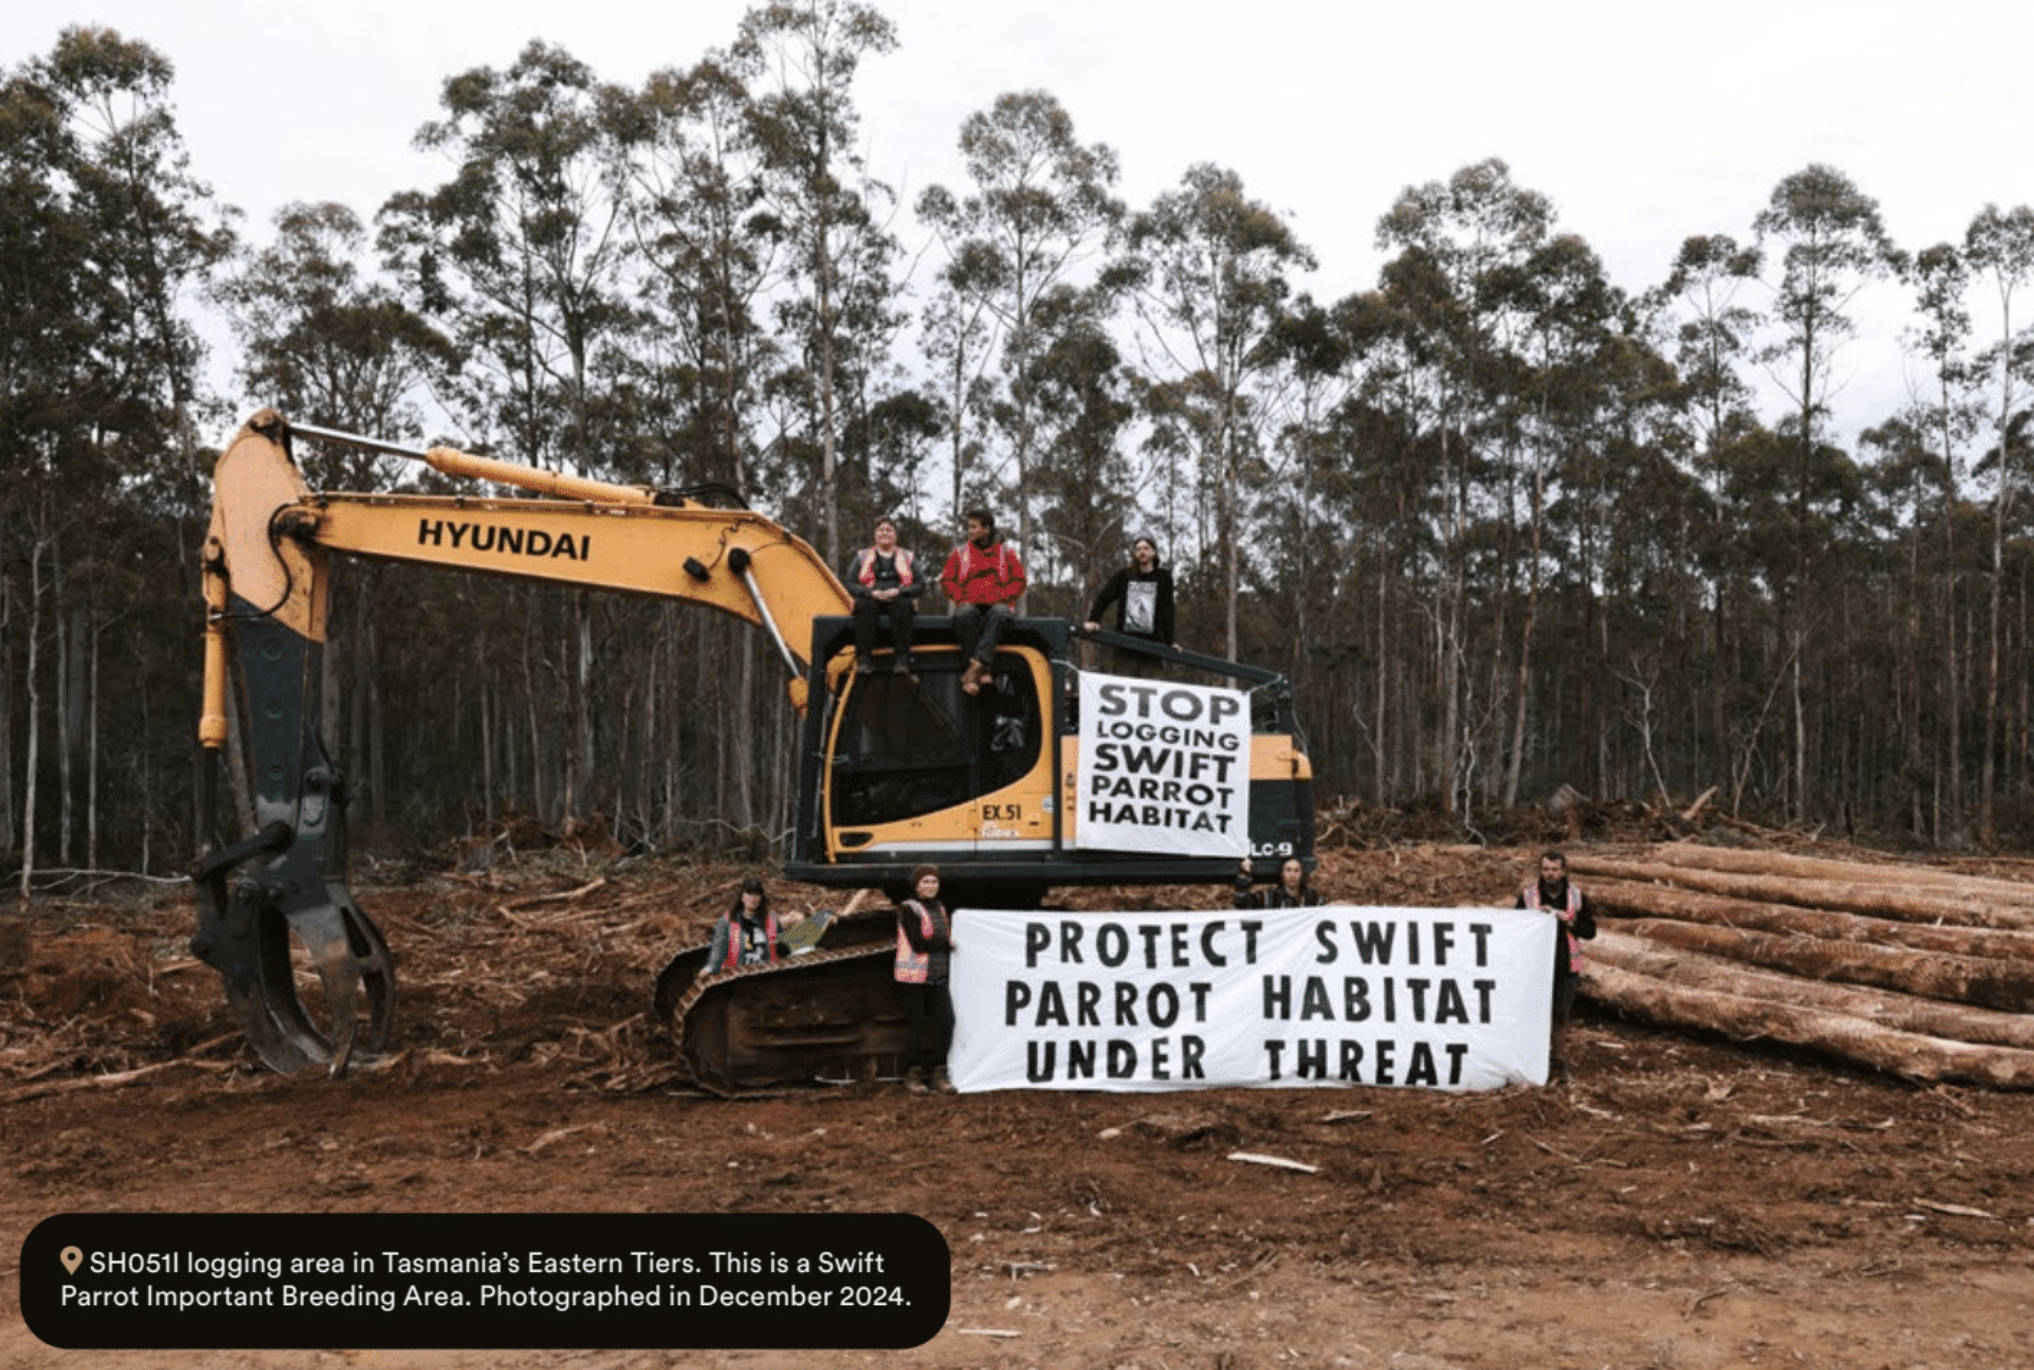
Logging continues to destroy Swift parrot habitat
Needless to say, NSW isn’t the only state that continues to log native forests with disastrous consequences for threatened wildlife.
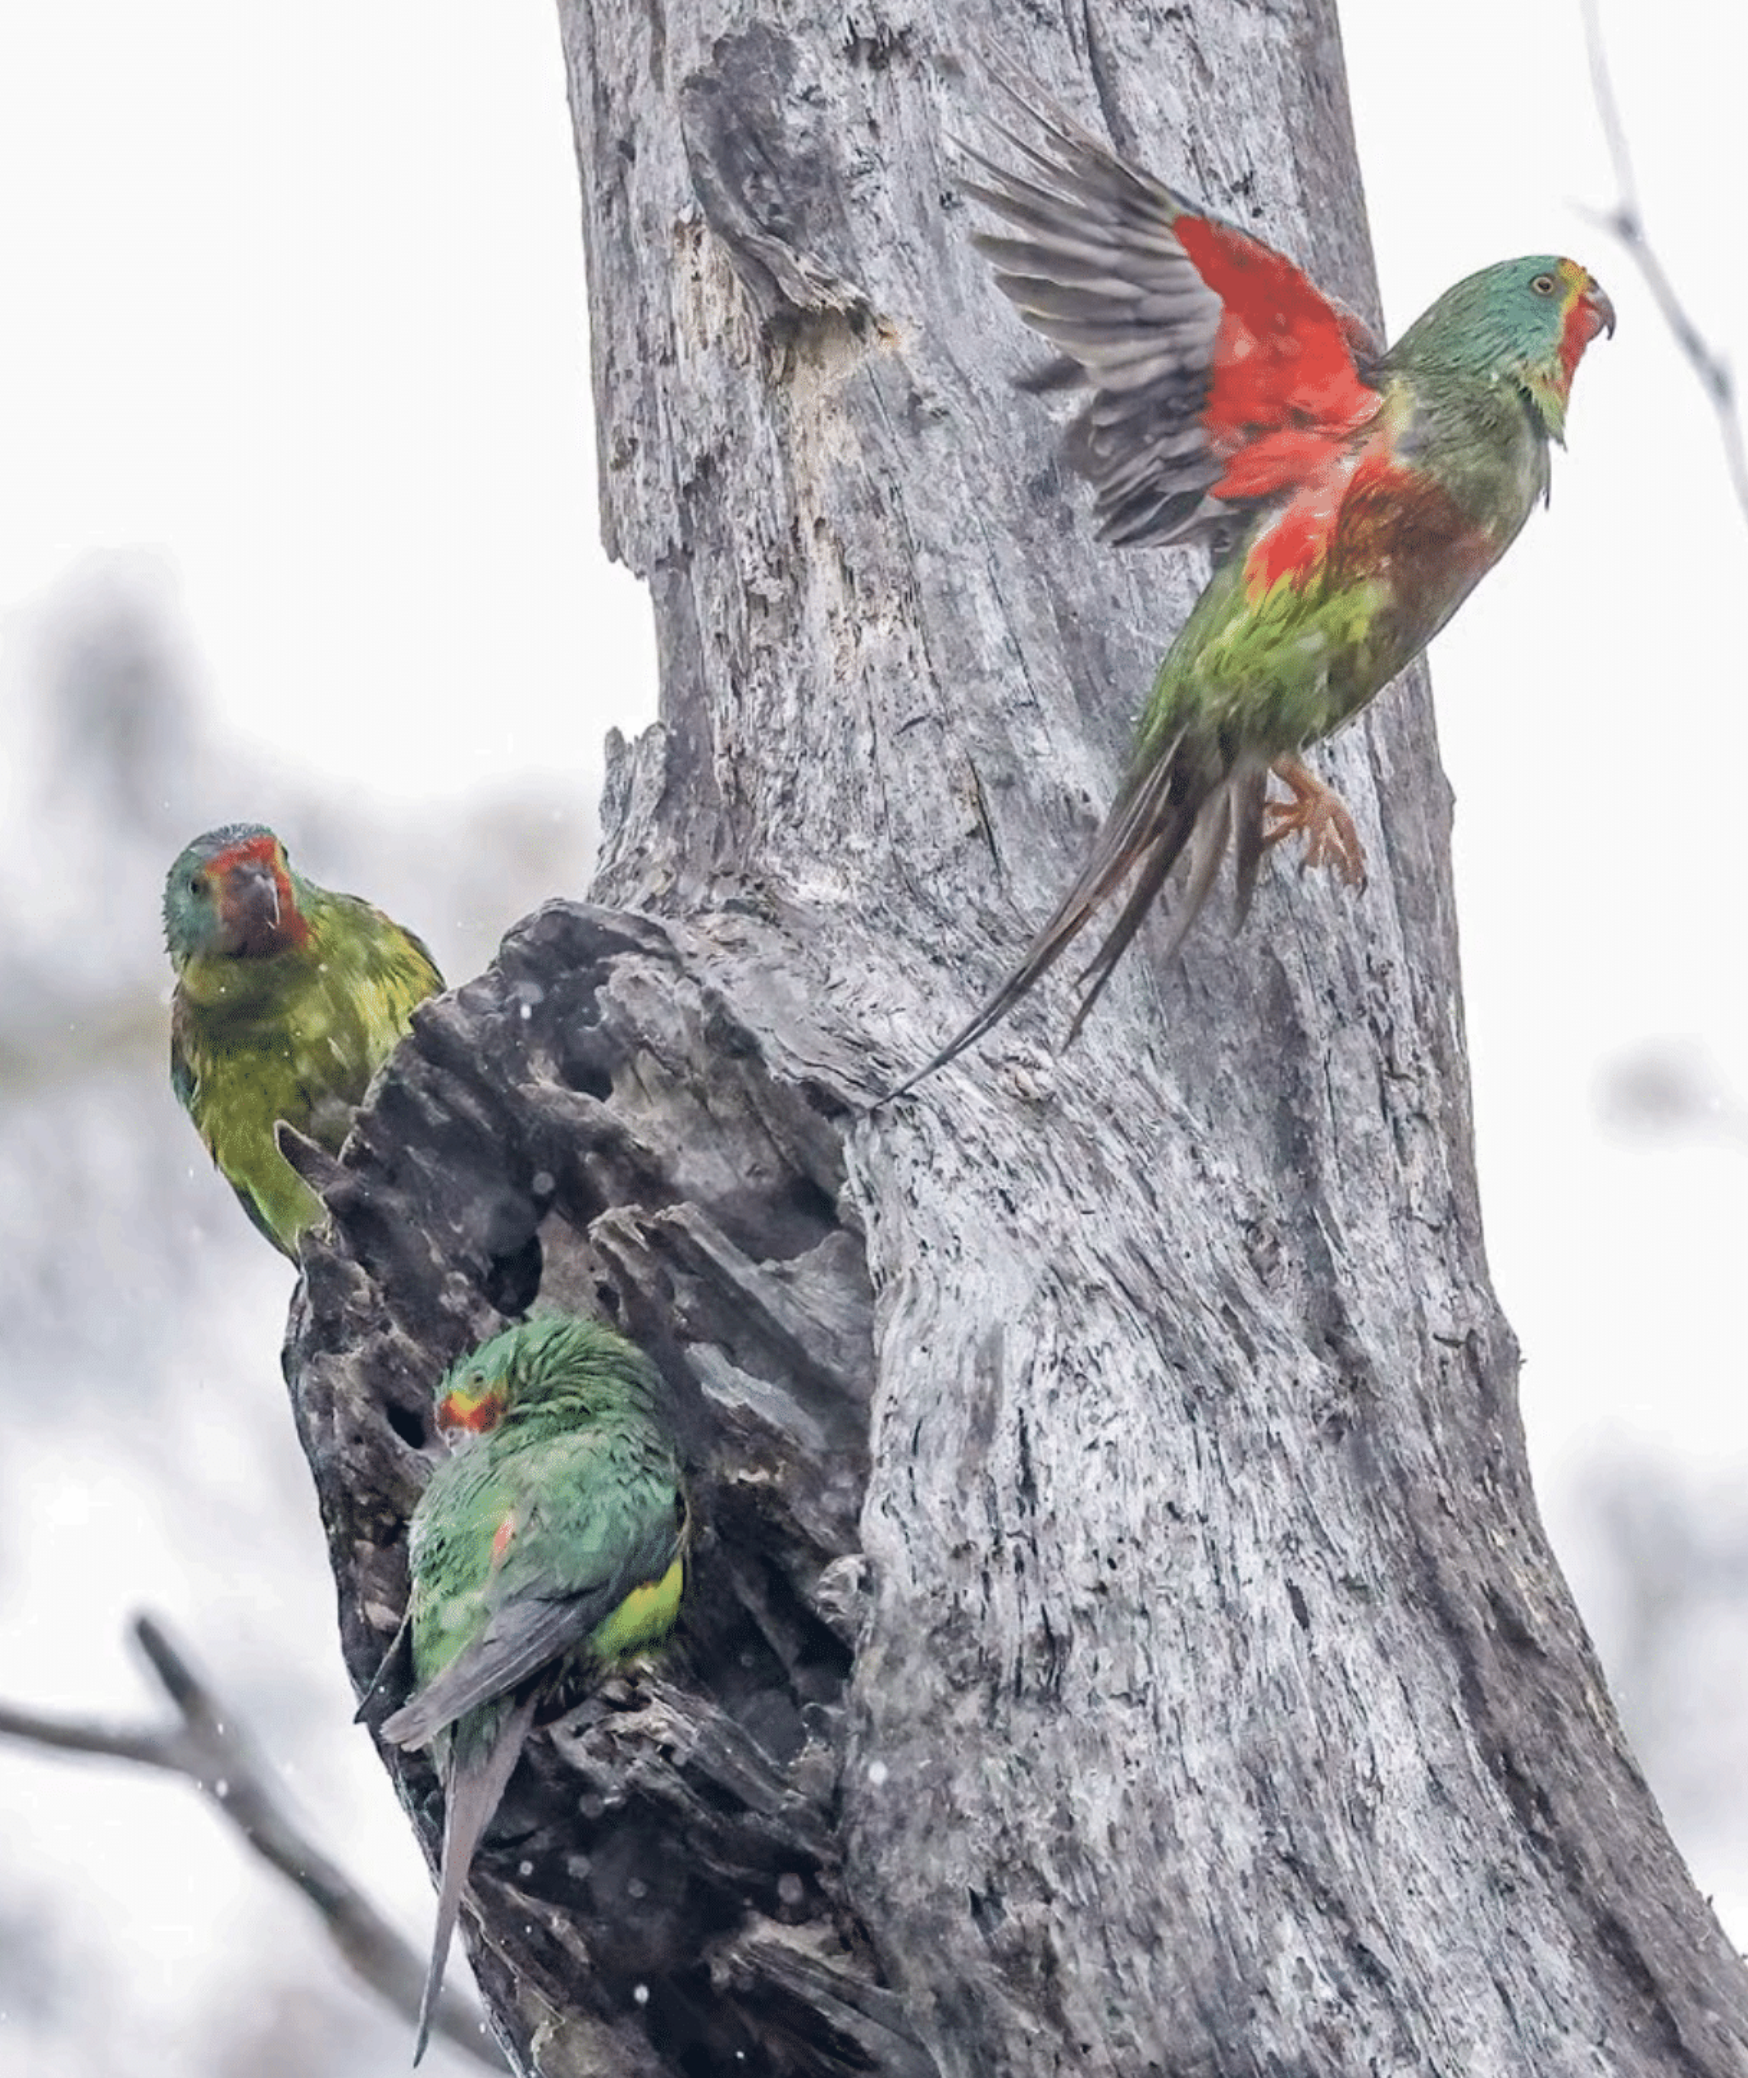
Swift parrots are one of only three species of migratory parrot in the world. They breed in native forests in Tasmania in late spring and summer and migrate to Victoria and NSW for the colder months. Their old growth forest habitat has been seriously diminished by logging in all three states, but the consequences have been particularly damaging in Tasmania where approximately half of their breeding habitat has been, and continues to be, destroyed.
In 2016, Swift parrots were listed as Critically Endangered under the Commonwealth Environment Protection and Biodiversity Conservation Act (yes, the one that has been under review for the last six years). However, despite there being fewer than 500 birds left, the state and Commonwealth governments refuse to protect the swifities’ disappearing habitat by:
- Immediately ending all native forest logging, at least on public land to begin with; and
- Restoring all areas of logged Swift parrot habitat.
Government inactivity is not due to lack of information or even economics (the sensible economic decision would be to end the logging). It’s entirely due to self-interest, votes, politics and not caring.
Is Trump swimming against the energy tide?
President Trump may be desperate for the Nobel Peace Prize but he is waging war on renewable energy. As well as making it increasingly difficult to build wind and solar farms and use EVs, he’s doing all he can to stop the closure of coal mines and coal-fired power stations and facilitate the extraction, use and export of oil and gas. He’s also ensuring that the US Government neither generates nor makes publicly available scientific evidence about climate change and he likes to punish individuals, companies and states that disagree with him.
Logically, if you are the MAGA demagogue, or in your own imagination the Demigod of MAGA, why wouldn’t you pursue such policies? Fossils fuels were a significant contributor to America’s 20th century hegemony which Trump is keen to restore.
But fossil fuels are losing their appeal and the hegemony is fading. The dominance that China enjoys (perhaps soon to be joined by India) in the production, use and export of technology for renewable energy and information technology is seeing the centre of influence shift to Asia.
But Trump is also up against some powerful trends within his own country. The uptake of renewable energy sources (mainly wind, utility-scale solar and hydropower) has been steadily increasing over the last two decades and it now generates 23% of the US’ electricity. Natural gas has been the fastest grower though and it now generates 43% of the electricity. Nuclear’s market share has been stagnant for many years.
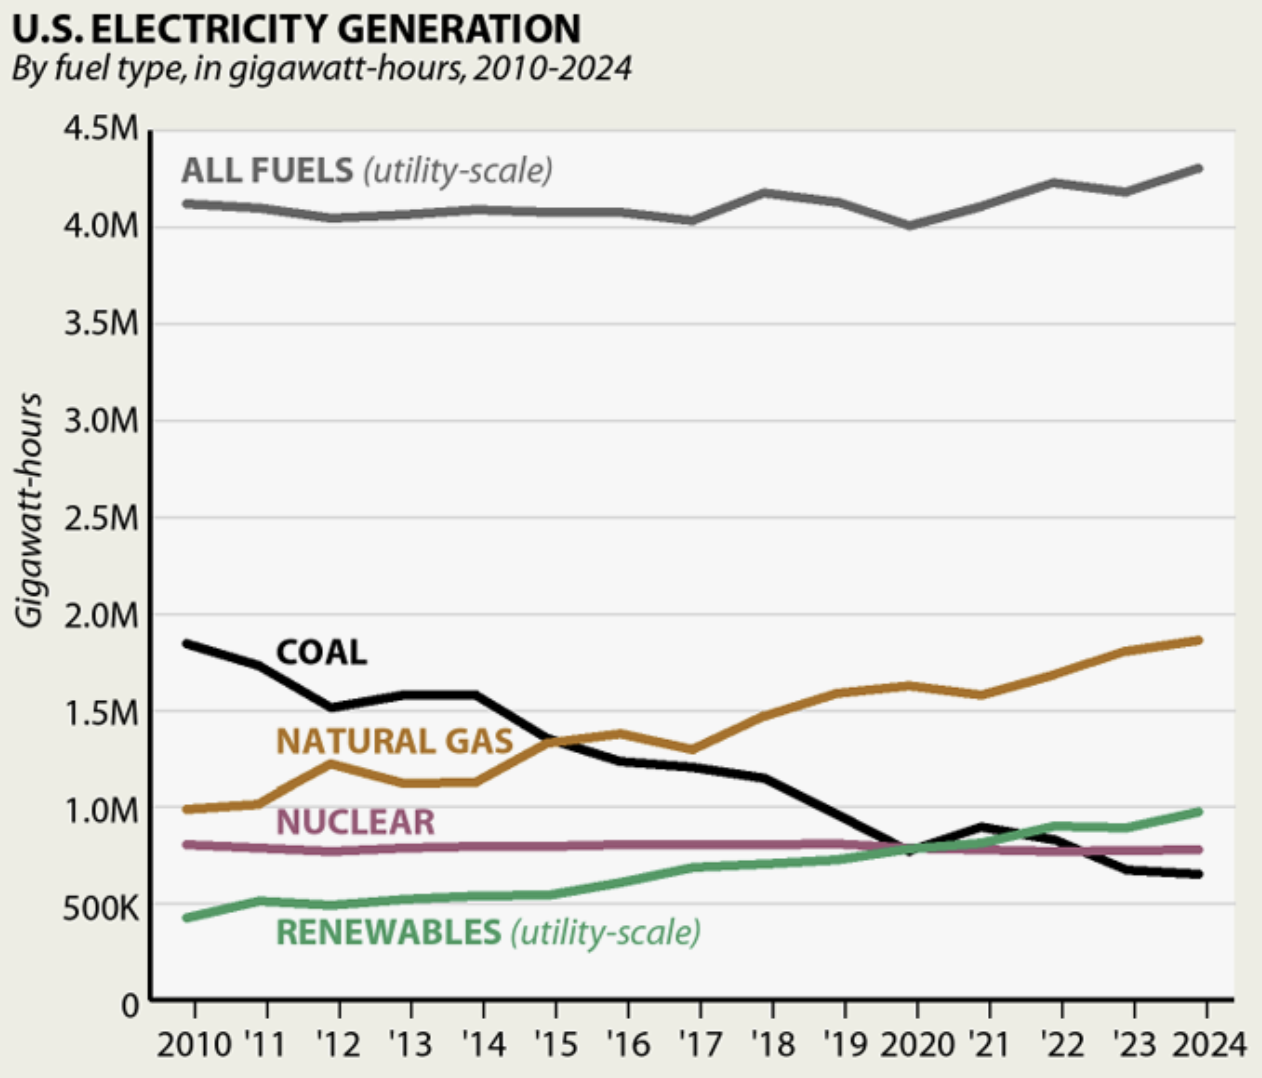
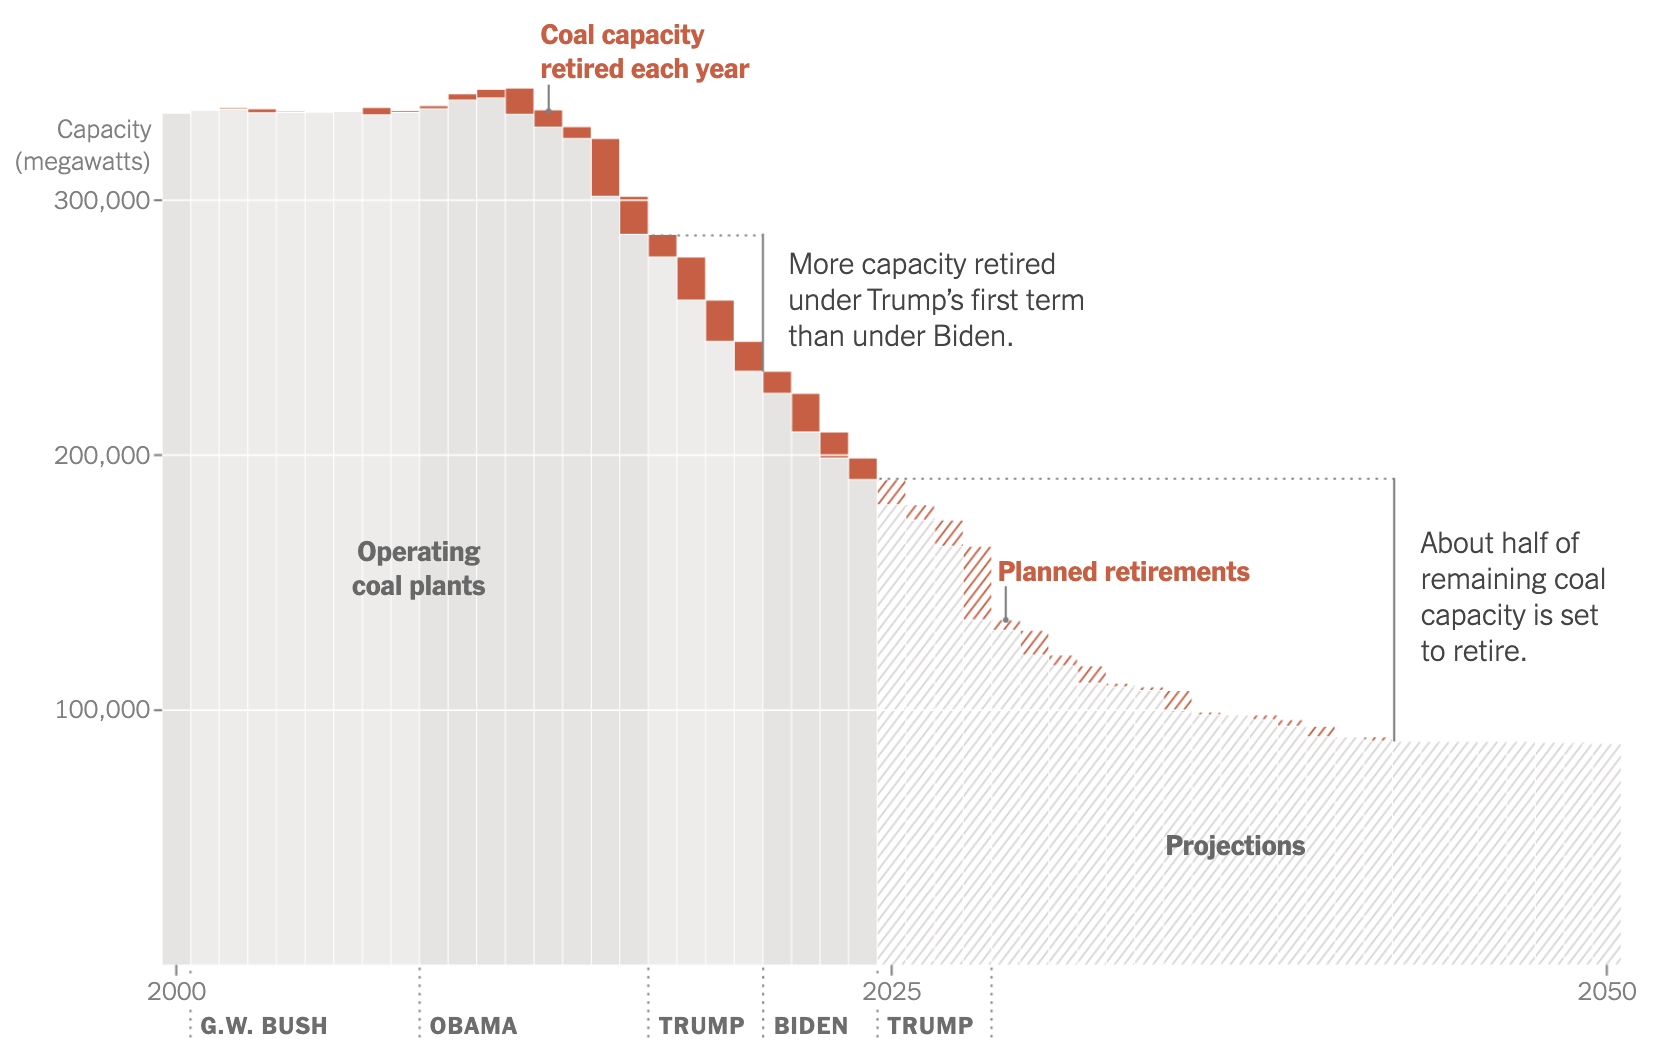
The big loser has been coal which has been on a rapid decline from producing about 50% of the US’ electricity around 2010 to 15% in 2024. It’s difficult to see coal’s decline stopping whatever Trump does. He failed to stop the decline in coal’s electricity-producing capacity in his first term and there are many more power station closures planned for his second. He may be able to slow the decline but he seems unlikely to stop it.
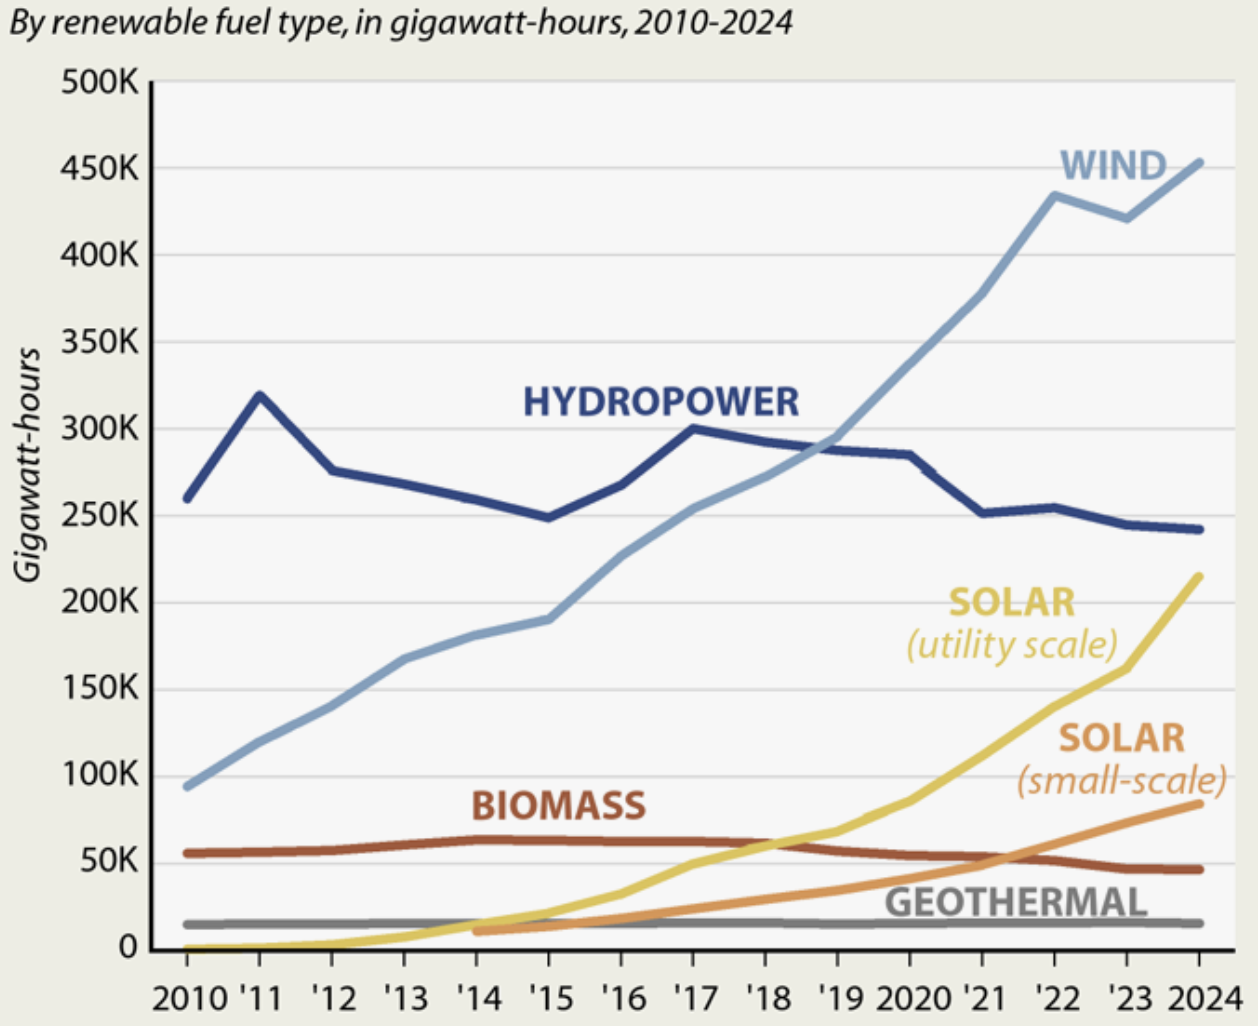
Among the various modalities of renewable energy, wind has been increasing rapidly and is now the US’s largest renewable electricity provider. Both utility-scale solar and small-scale solar (less than 1 megawatt capacity, not included in the graph below) have been increasing steadily since around 2015.
Among the states, Texas leads the way in using renewable sources to generate electricity, largely relying on wind, although it has been rolling out lots of utility-scale solar recently. Currently, Texas’ wind power alone is greater than all of second-placed California’s renewable energy, which mainly comes from solar. The next five on the list are all mid-western windy states.
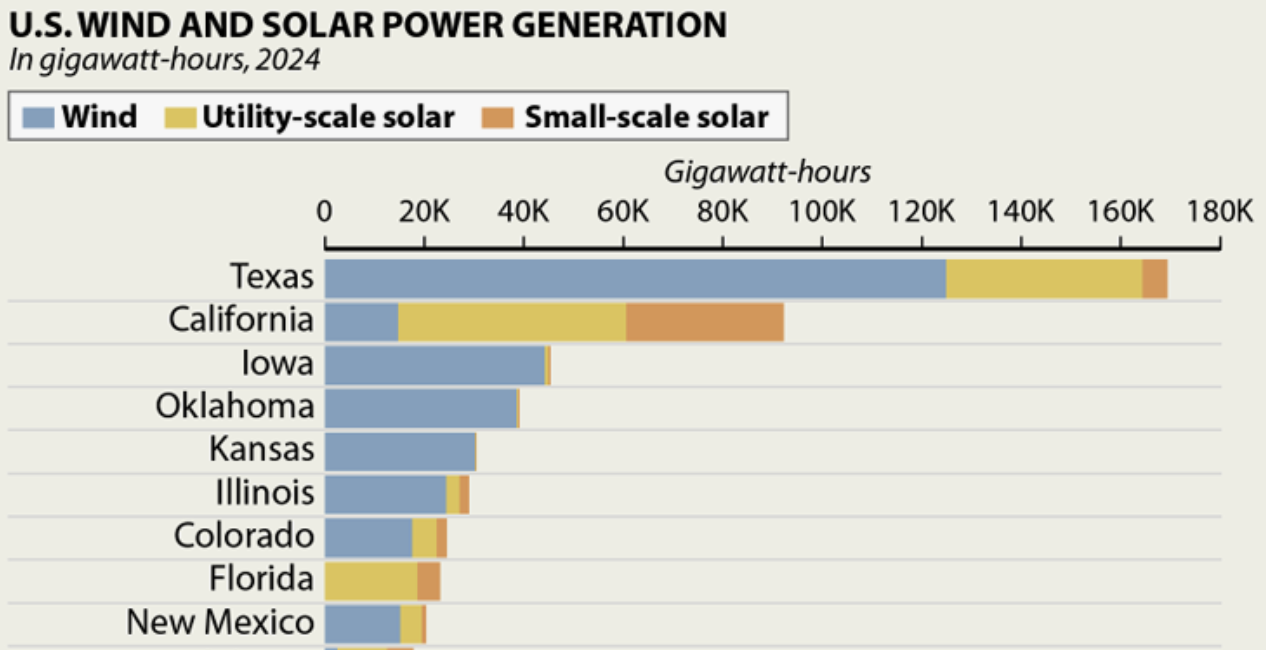
Interestingly, in the global centre of capitalist market competition, only in Texas do electricity providers compete on price. In most other states, power plants enjoy guaranteed profits under state legislation.
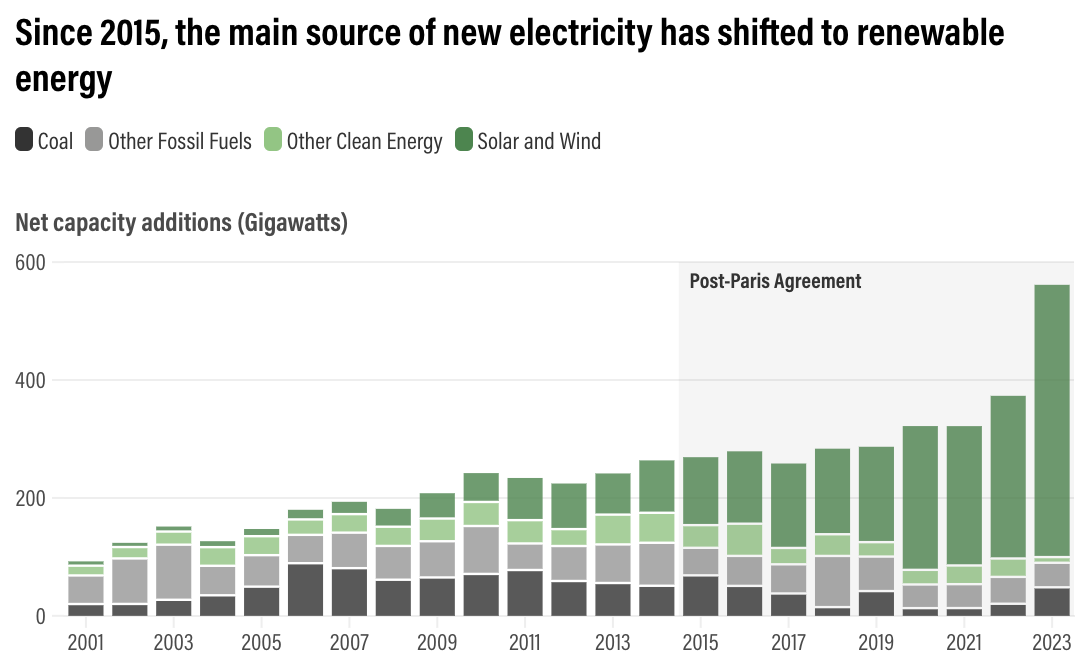
To put the trends in the US in a global context, since 2015 the main source of new electricity has been renewables.
And finally, for comparison, Australia produces about a twentieth as much electricity as the US, or roughly about as much energy as Texas and California produce together just from renewable sources.
We know virtually nothing about the deep seafloor
The deep ocean, including the ocean and the seafloor, is the largest ecosystem on Earth, really many ecosystems. Of the Earth’s total surface area, 66% is deep ocean floor, where the water is more than 200 metres deep.
The deep ocean is critical for the Earth and for humans in many ways, for instance for climate regulation, oxygenating the atmosphere, food and pharmaceuticals. And yet it is Earth’s least explored ecosystem and we know very little about it.
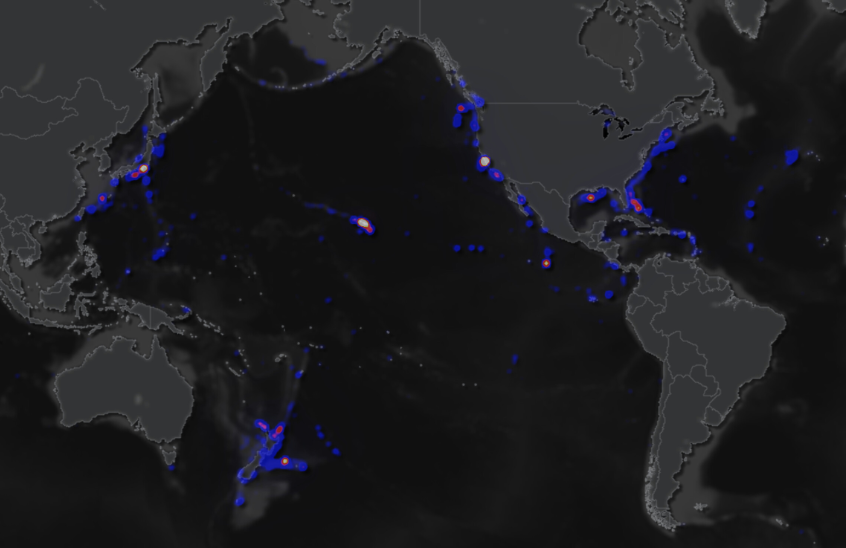
Despite all the advanced deep-sea technology that has become available to us, we have visualised less than 0.001% of the deep seafloor since 1958; an area about the size of the ACT. Most of the explorations (65%) have been conducted within 200 nautical miles of three countries: US (particularly Hawaii and Monterey Bay), Japan and New Zealand. The map shows the locations of most of the explorations; the whiter the colour, the more explorations at that site.
The views expressed in this article may or may not reflect those of Pearls and Irritations.