Environment: State-owned fossil fuel companies dominate CO2 emissions
February 22, 2026
16 state-owned fossil fuel companies top the CO2 emission charts, nations need to be rich to electrify and need to electrify to get rich, and Norway drives the EV boom.
Country or company, where do emissions originate?
There is a tendency to focus on the countries of origin of coal, oil and gas rather than the organisations that extract the fuel from the ground. This is largely a function of, firstly, national governments, regardless of their differing political ideologies, providing the main governance of societies, and secondly the UN system for tackling climate change, including the Paris Agreement, which is based around independent nations.
While there’s no doubt that this arrangement suits the coal, oil and gas producing organisations very nicely, it also has to be accepted that national governments are still the only bodies that might take tackling climate change seriously and have the power to do anything meaningful about it.
Carbon Majors is a database of the historical and current CO2 and all greenhouse gas (GHG) emissions arising from the activities of 166 of the world’s largest currently active coal, oil, gas and cement producers (plus 12 that are now inactive). The emissions include the direct production-related emissions (Scope 1 GHGs) and the emissions arising from the combustion of the fossil fuels (Scope 3 GHGs). Of the 178 producers (the “Carbon Majors”), 100 are investor-owned and 78 state-owned/controlled.
The conclusions that can be drawn from the data relating to 1854-2024 reveal some interesting patterns and trends that illuminate the inseparable relationship between countries and companies among the major GHG producers:
- GHG emissions generated by the fossil fuel-related activities of the 166 Carbon Majors are still increasing (0.8 per cent higher in 2024 than 2023).
- A small number of producers are historically and currently responsible for most of the emissions. The main emissions producers have been getting bigger and fewer in number over the last decade as a result of mergers and acquisitions and the expansion of production.
- The fossil fuel industry is increasingly dominated by state-owned/controlled producers.
- The top 10 GHG-producing companies in 2024 (responsible for 28 per cent of the emissions) were all state-owned/controlled (as were six of the next 10). Saudi Arabia, China, India, Iran and Russia feature prominently.
- The largest producers are responsible for the continuing growth in emissions and are better able to ride out market shocks (such as the one caused by Covid).
- The 10 state-owned/controlled and 10 investor-owned producers with the highest emissions have been and remain active opponents of policies to tackle climate change.
If you’d like a few more actual numbers:
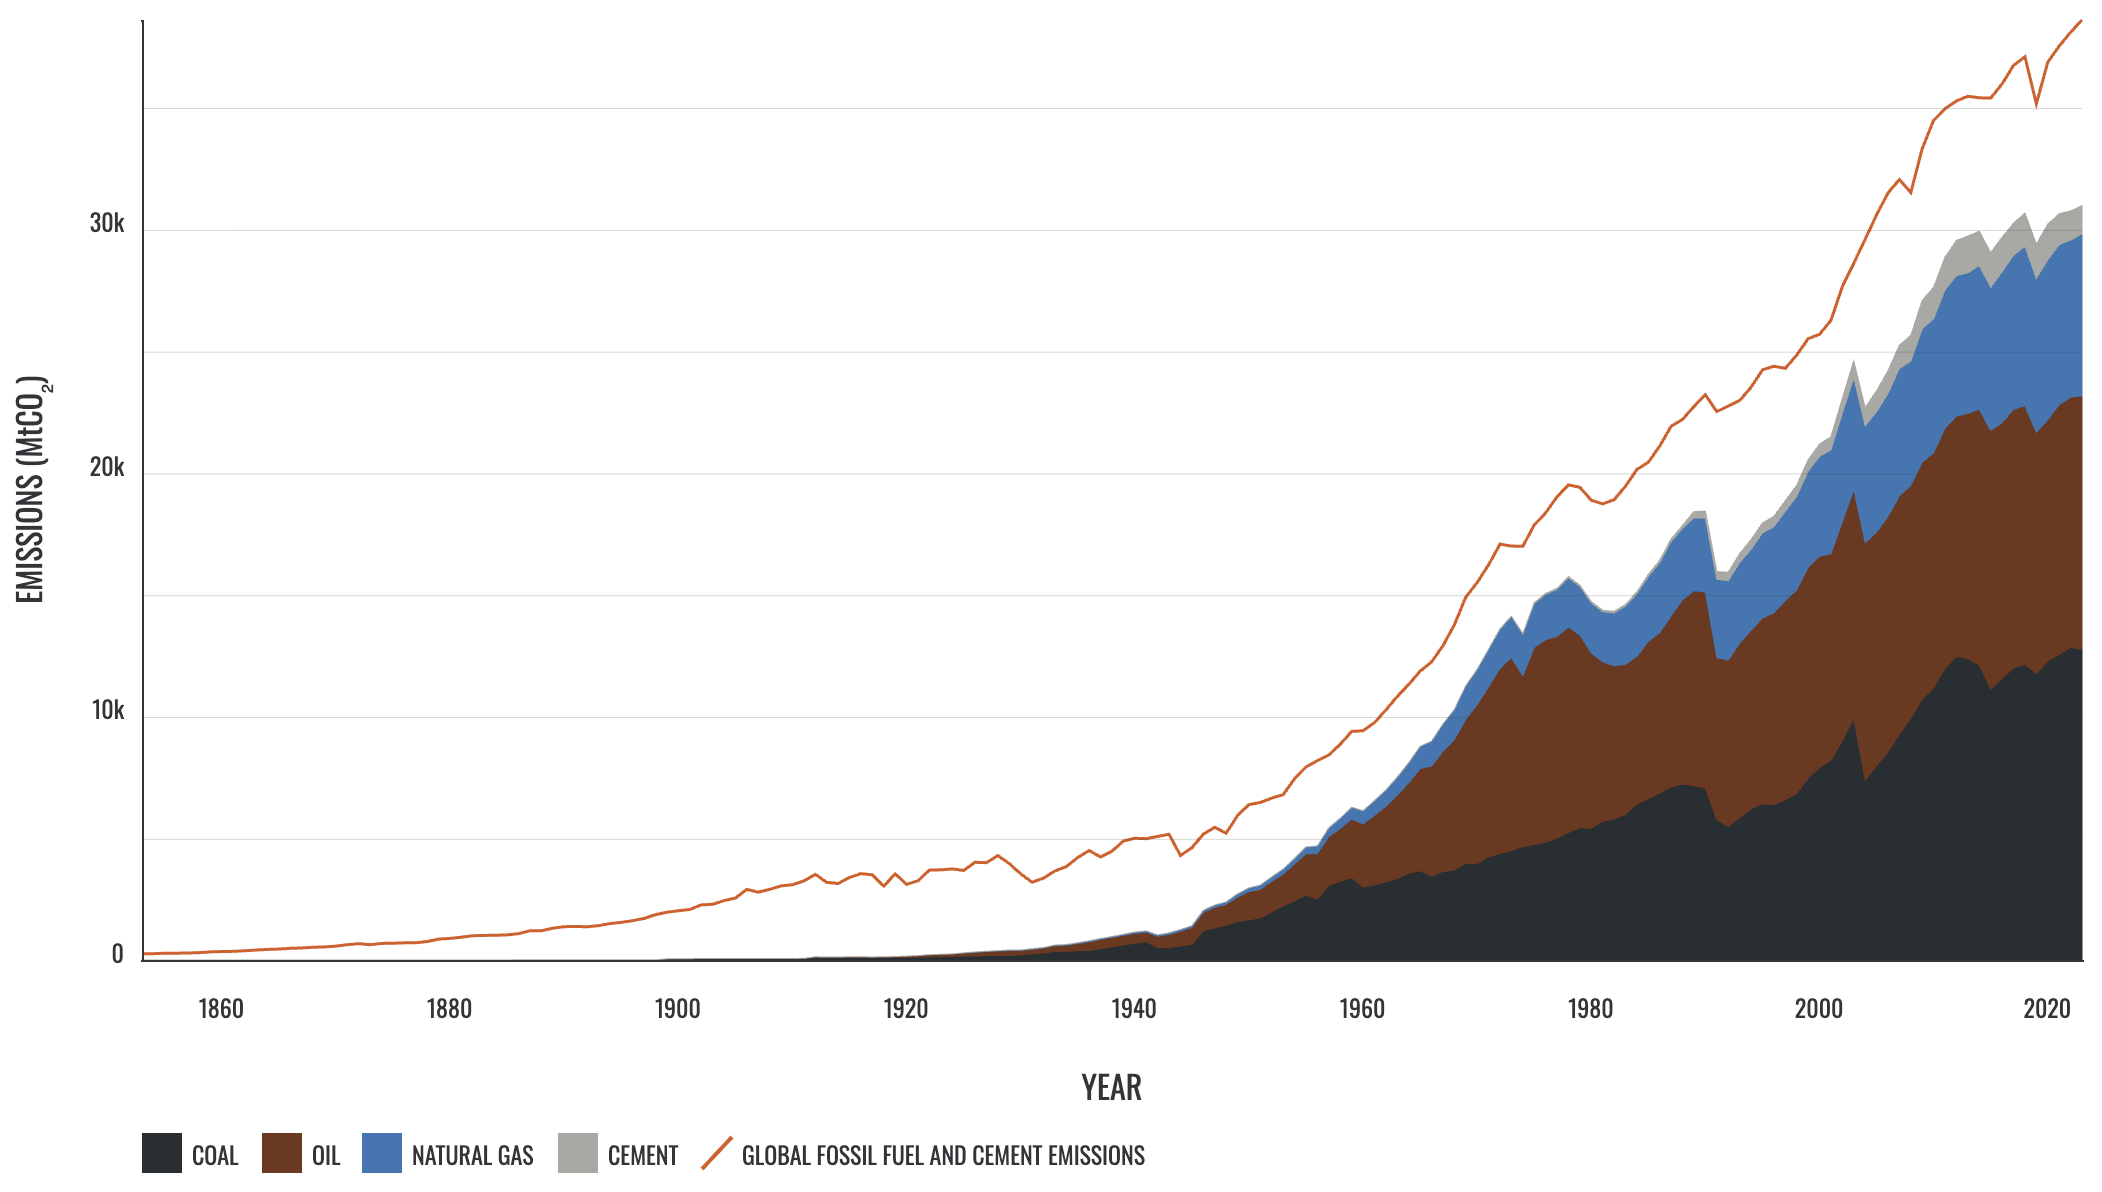
- The graph below shows the emissions of CO2 (not all GHGs) attributable to the 178 Carbon Majors and all global fossil fuel- and cement-related emissions between 1854 and 2024. Since the 1950s, most of the emissions have been caused by the Carbon Majors – 80 per cent in 2024.
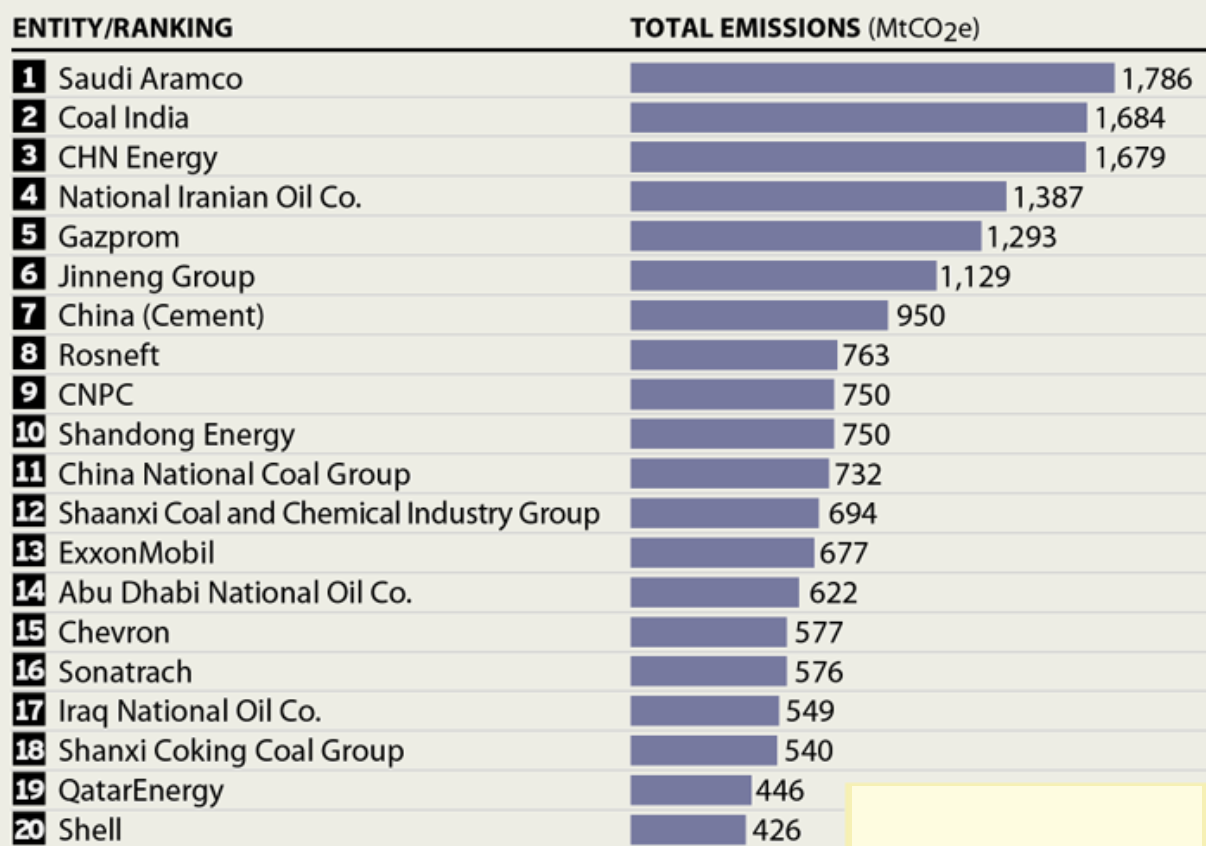
- 32 producers were responsible for over half of the emissions of CO2 from all global fossil fuel and cement producers – down from over 40 producers before 2014. The bar chart below ranks the 20 biggest GHG emitters in 2024.
- While total emissions from the 166 producers declined in 2020 due to Covid, the collective emissions of the 32 companies responsible for over 50 per cent of emissions increased.
- The 72 state-owned/controlled producers in 2024 were responsible for 56 per cent of emissions and over half of them increased their emissions in 2024.
- Over a third of the CO2 emissions from all fossil fuel and cement producers between 1854 and 2024 were generated by 22 producers. State-owned/controlled producers, mainly Soviet Union/Russia, China and Saudi Arabia, have been by far the largest contributors since the 1970s.
- In 2024, the top five state-owned/controlled producers (based in Saudi Arabia, India, China, Iran and Russia) produced 7.8 per cent of global CO2 emissions. The top five investor-owned producers (ExxonMobil, Chevron, Shell, BP and ConocoPhillips) produced 5.5 per cent.
In summary, GHG emissions from fossil fuels and cement are mainly originating from a shrinking number of ever-larger producers that are expanding output and blocking climate action. The biggest producers are government owned or controlled organisations and even the well-known private companies (BP, Shell, Peabody, etc) are well down the production list. To quote Christiana Figueres: “Carbon Majors are clinging on to outdated, polluting products and continue to mislead the public on the urgent real-world consequences of their actions.”
Australia doesn’t have any state-owned fossil fuel producers but bitter experience tells us that the government and coal and gas companies don’t need to be in a formal union for them to be in bed together. What doesn’t change, however, is that the ones that get fucked are the environment and communities.
Wealth and electricity consumption walk hand in hand
The scatter plot below, for the years 2022 or 2023, is from Bloomberg Green Daily on 15 December 2025. GDP is measured in current US dollars. Note that both variables are presented on logarithmic scales. I don’t know for sure which dot is Australia but it’s pretty close to the one circled in red.
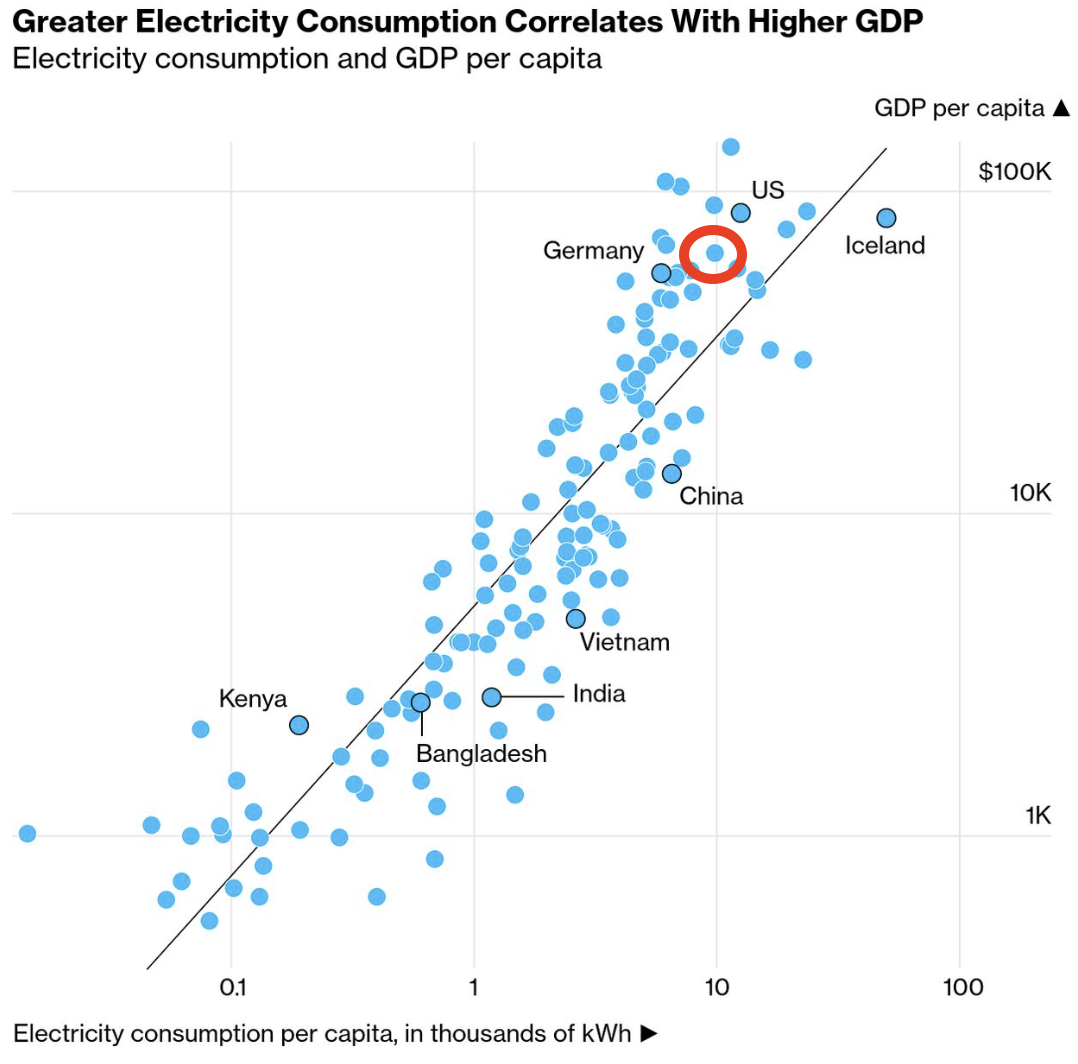
Access to cheap, reliable electricity has been a long-standing problem in poorer countries, particularly for disadvantaged people and rural communities. The scatter plot illustrates the very clear correlation between national wealth and electricity consumption and hence why building electricity generation and transmission capacity is such an important element of social, industrial and economic development in low and middle income countries. Rather than one being the cause of the other it is, of course, a spiralling relationship and the growth of electricity generation and consumption in developing countries is bound to continue for the foreseeable future, preferably from renewables.
Deindustrialisation and increasing energy efficiency has largely kept the demand for electricity flat or falling in developed countries in recent years. However, the rapid rise of AI, data centres and web use, increasing sales of EVs and the broader electrification of all aspects of industrial and domestic life have recently led to increasing demand for electricity even in rich countries. This is placing increasing demands on generation and transmission systems, compounded by disruptions created by climate change.
Generally speaking, I’m not too concerned about unreliable access to power holding back economic growth in rich countries but it does worry me if it is holding back developing countries.
Norway is leading the EV sales race
Norway was first out of the EV starting gate and has led all the way. They are slowing a little in the final 100 metres but the closest chasers are still barely half way home. The countries shown below, plus many other European nations, dragged the global EV sales average up to 22 per cent in 2024 but many nations are well below this. In the US, EV sales were 10 per cent of the total, as it was in Australia in 2024.
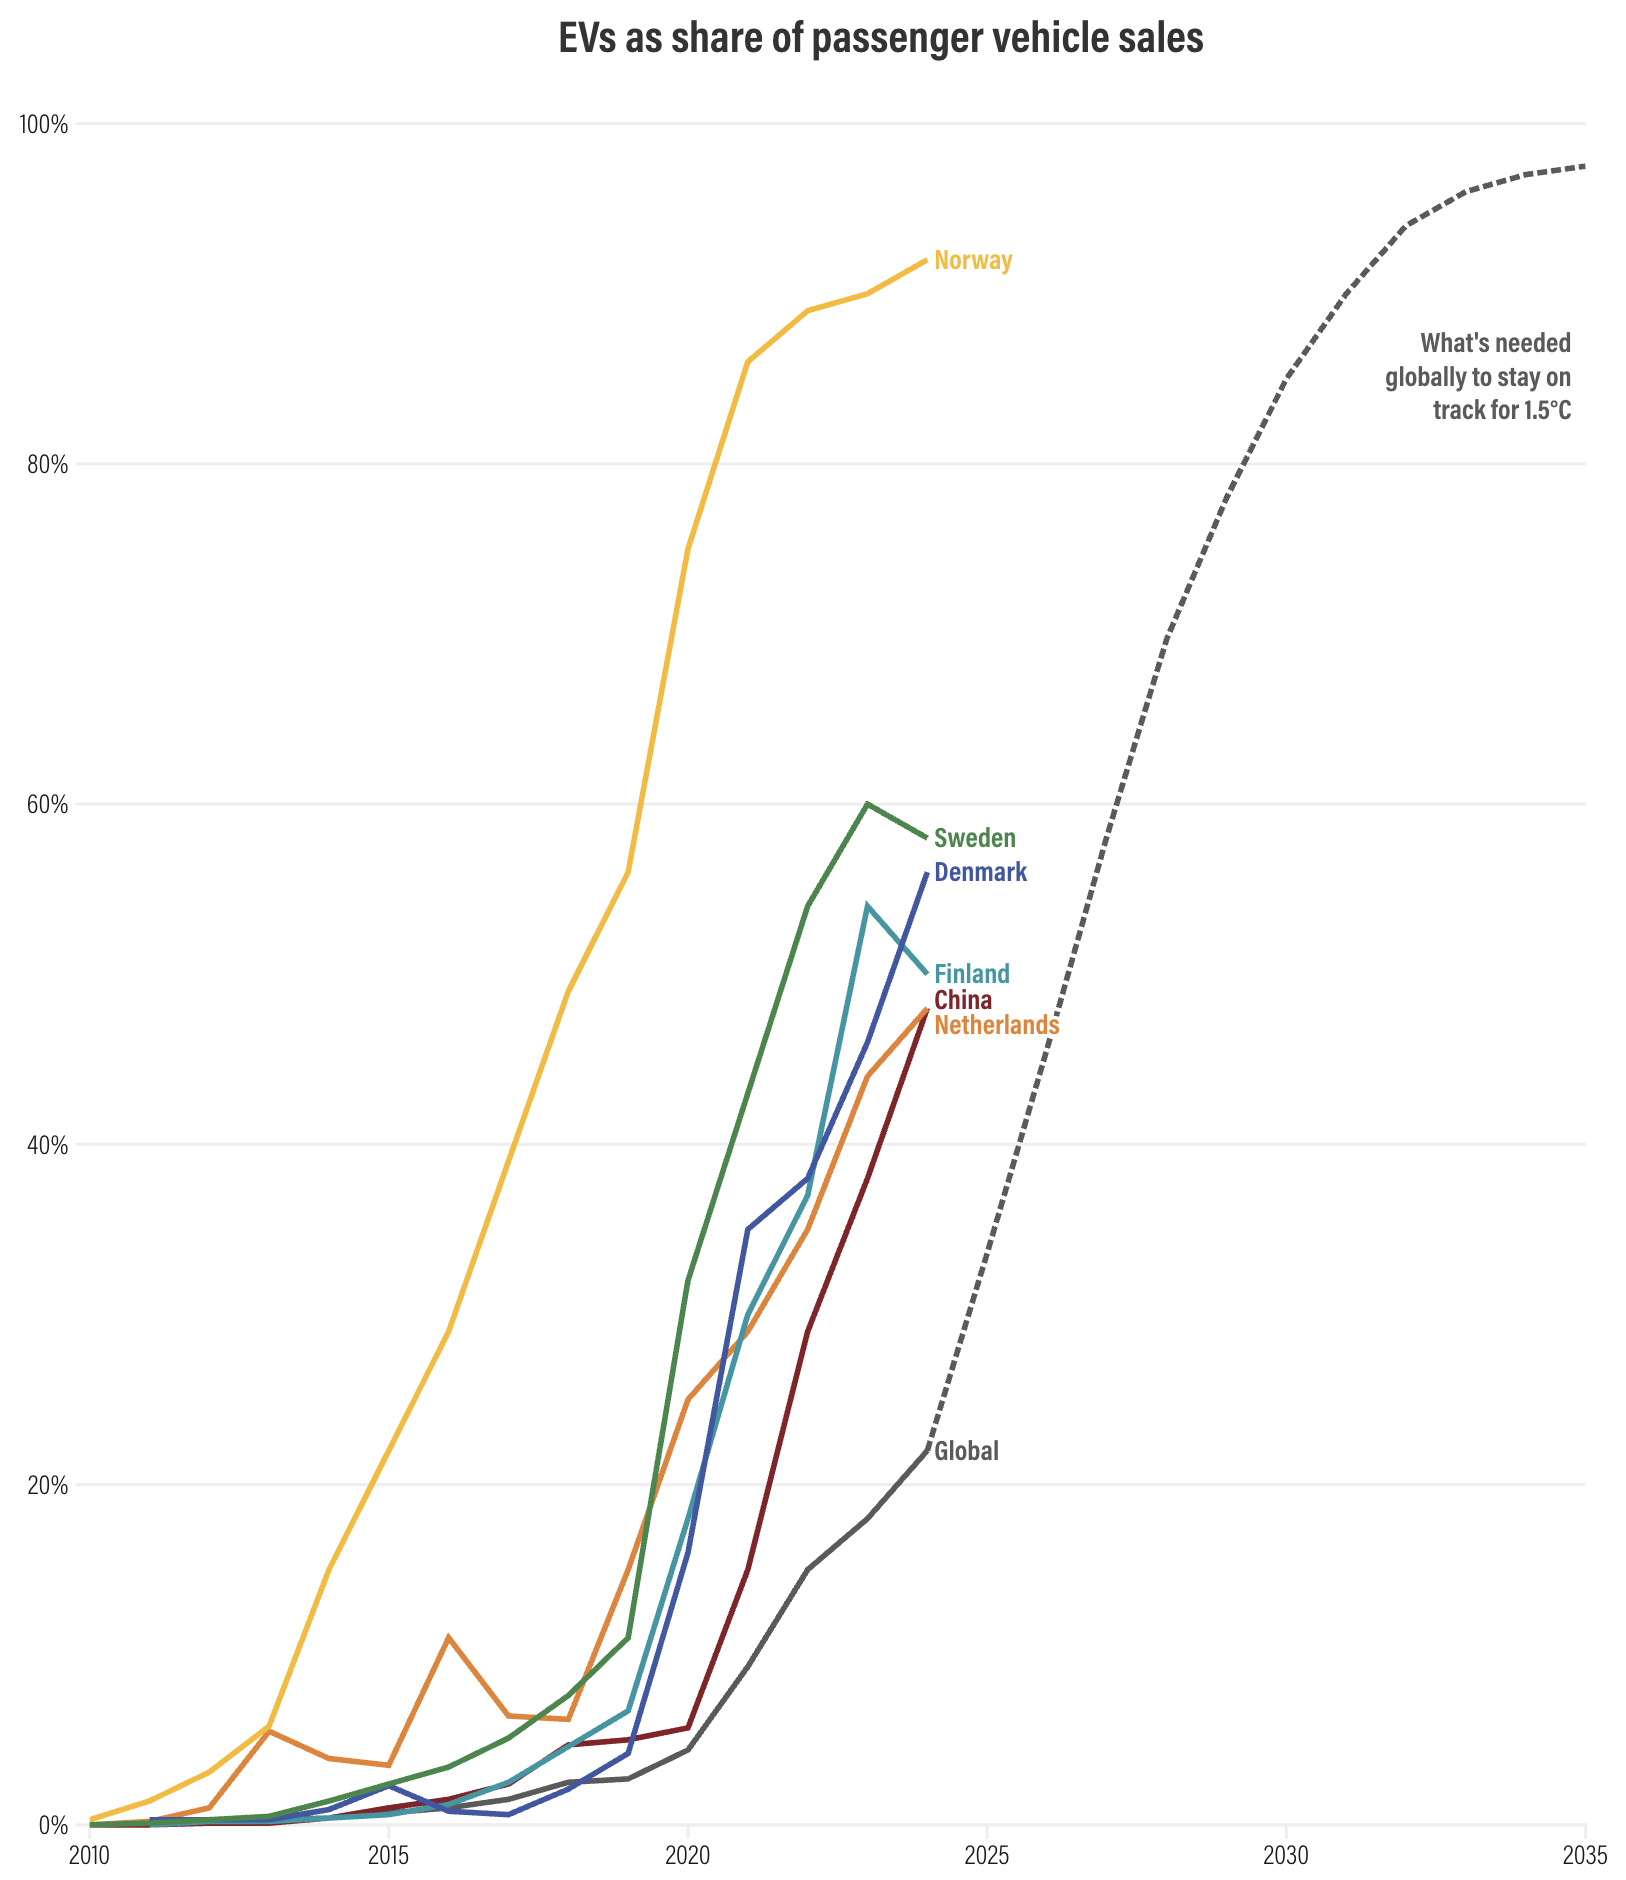
EVs in this graph includes all electric and plug-in hybrid vehicles.
The next two annotated graphs from Norway and China (which accounted for 11 million of the global 17 million sales in 2024) show two crucial policies that governments can introduce to encourage sales: make the purchase price competitive through subsidies and tax breaks, and encourage the roll out of charging stations, although target dates for EVs being 100 per cent of sales also seem to be important.
The EV facts of life
Which are true, which false?
- An EV has to travel 80,000+ km to break even.
- Electric vehicles have little or no CO2 advantage over the petrol car you currently drive.
- Old bangers should be the green motorist’s choice.
- EVs simply displace carbon emissions from roads to distant power stations.
- Synthetic petrol could displace electric vehicles.
- Hydrogen cars are more sustainable than EVs.
- There are insufficient raw materials for all vehicles to be EVs.
- EVs can explode – petrol ones only do it in movies.
- Super heavy EVs produce more pollution than petrol and diesel cars.
Consuming protein without destroying the planet
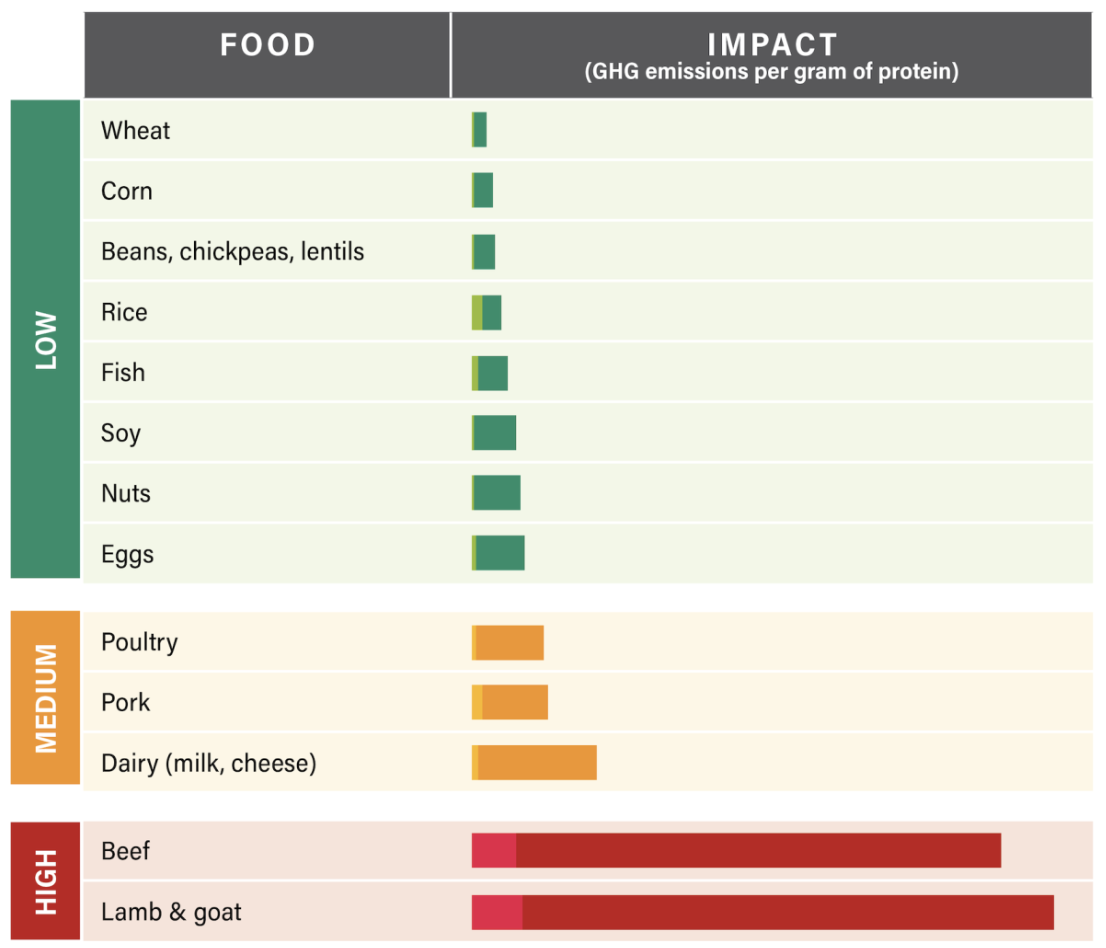
As a rule of thumb, if you are a climate-conscious protein-lover, it makes sense to eat plants rather than animals, choose fish and poultry rather than mammals when you really want to eat meat, and treat beef, lamb and goat as luxuries to be consumed in small quantities.
The vast majority of agricultural GHGs are associated with the land-use change that precedes the introduction of farming (the darker coloured parts of the bars in the chart below) rather than the actual rearing of animals. This makes a strong case for halting land use change but I suppose it’s also possible for the committed carnivore to justify their choice by saying the destroyed forests are long gone and the emissions currently produced by rearing beef and lamb are much the same as soy and nuts.
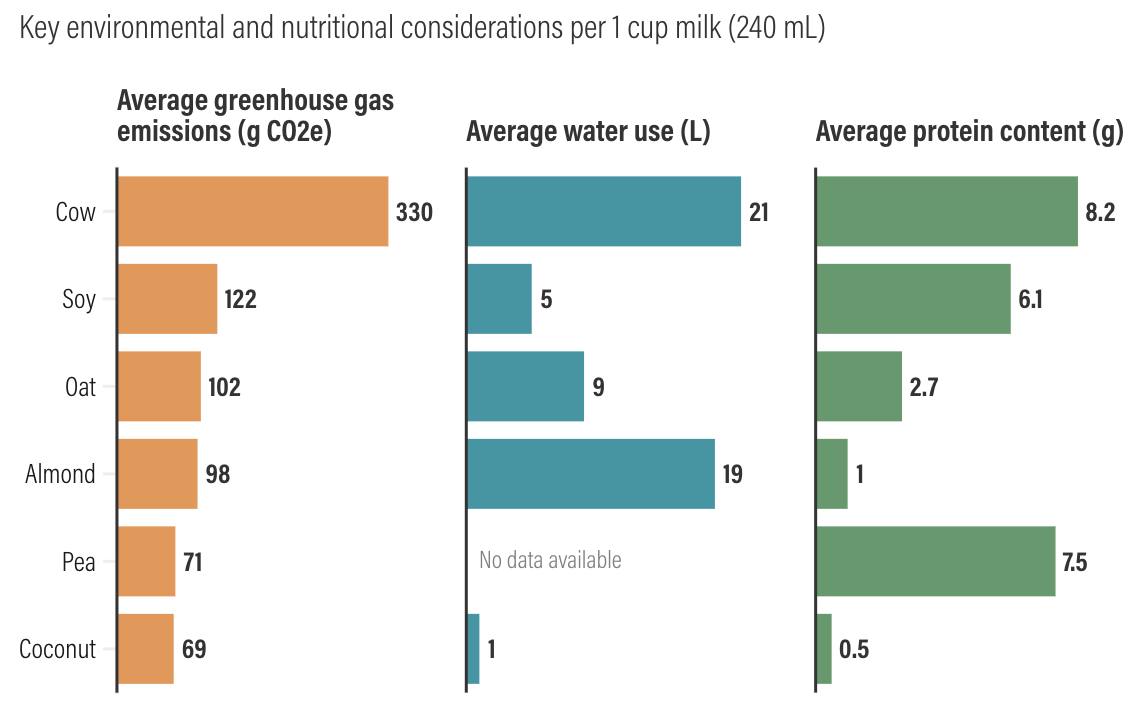
If you’re looking for the best low emissions-high protein trade-off for milk, soy, oat and pea look like the best options. Almond’s water consumption is its downfall.
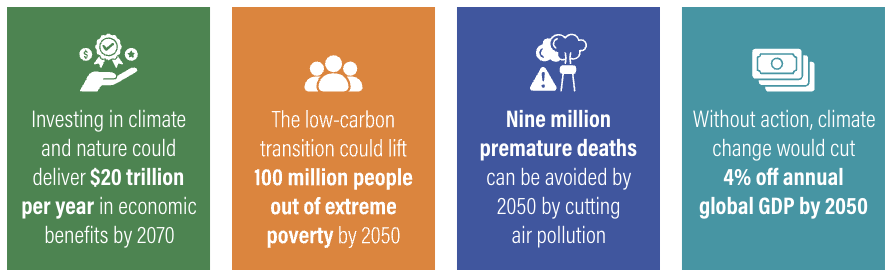
Benefits of climate action
In 2025, the UN Environment Program produced the massive '_A future we choose. Why investing in Earth now can lead to a trillion-dollar benefit for all_'. The Executive Summary alone is over 50 pages but the figure below provides a snappy summary of how investing in system-wide, whole-of-society transformations (of what needs to be avoided, phased out, preserved and developed) of economic, financial, materials, waste, energy and food systems could generate an additional US$20 trillion of economic benefits per year by 2070 and produce a resilient and sustainable environment, reduce poverty and prevent premature deaths. What’s not to like?