ABUL RIZVI: Why 5% unemployment today is not the same as 5% unemployment 10-20 years ago
January 27, 2020
The unemployment rate, and even the underemployment rate, have become an inadequate measure of the true health of our labour market.
When unemployment increased to over 11 percent in 1992-93, we worried but were not surprised given the state of the economy. After all, our unemployment rate was over 10 percent just ten years earlier after the 1982-83 recession and we experienced similar levels of unemployment in the 1974-75 recession.
So when unemployment fell to less than 5 percent in 2006-2008, Australians enjoyed boom times with real wages rising rapidly and a strongly growing economy. It was a time we worried about high interest rates. John Howard promised us interest rates would always be lower under a Coalition Government a boast he may no longer wish to be repeated.
It was also a time net overseas migration was rising rapidly compared to each of the three recessions mentioned above. Net overseas migration fell sharply during each of our three major recessions of the past 50 years to levels around 50,000 and lower. Net overseas migration also fell after the Global Financial Crisis (when Australia did not fall into recession) but not nearly as far as it fell during the three major recessions (see data.gov.au for historical migration statistics).
With the unemployment rate falling to 5.1 percent in December 2019, a trend participation rate just below our record level of 66.1 percent and net overseas migration still at relatively high levels, why isnt our economy booming again?
This question has been the subject of much debate including the fact that a 5 percent unemployment rate today is not really the same as a 5 percent unemployment rate 20 or even 10 years ago.
But how can that be? Hasnt the definition of unemployment remained the same?
The unemployment rate measures the portion of people participating in the labour force who do not have a job. Of course people in employment are defined as anyone with a job even if it is only for one hour a week. If the portion of people with a job that employs them for only a few hours per week is significantly higher today than was the case 10 or 20 years ago, the unemployment rate would no longer be comparing like with like.
That would certainly be the case if more people are working as casuals or part-time or indeed in the gig economy. The ABS seeks to measure this effect by adding underemployment to unemployment to measure what it calls the underutilisation rate. It defines underemployment as people employed part time who wanted to work more hours and were available to start work with more hours.
But this remains a subjective measure of what people would like to have.
A better, more objective measure of the state of the labour market would be the average number of hours actually worked per month per adult.
Apart from being an objective measure, it also incorporates the impact of unemployment, participation, underemployment and population ageing.
In that sense it is a measure that is more readily comparable over time than the unemployment rate.
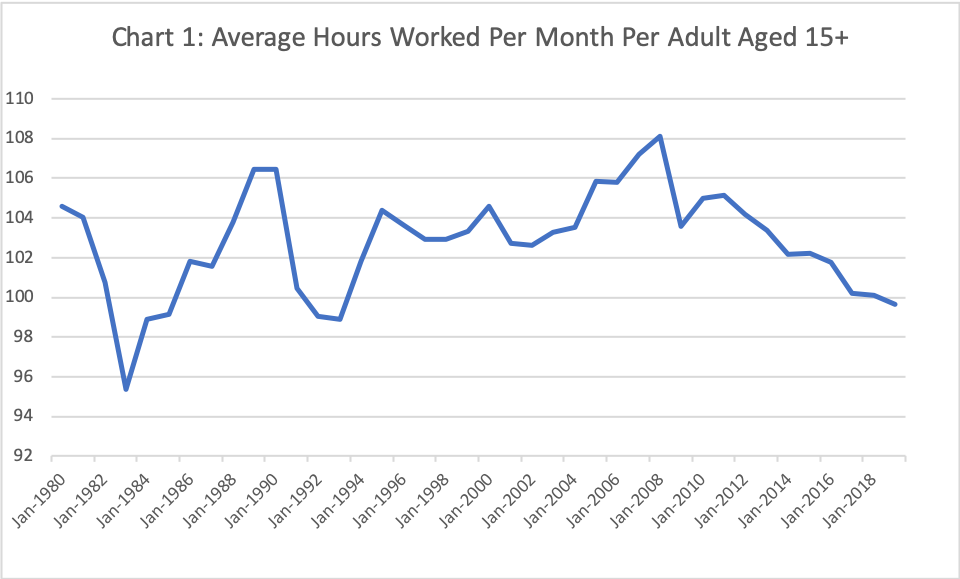
Chart 1 below tracks this measure for the last 40 years.
It clearly highlights the impact of the 1982-83 recession when average hours worked per month per adult fell to 95.4 and the 1992-93 recession when it fell to 98.9.

After peaking at 108.1 in June 2008, it fell sharply after the Global Financial Crisis to 103.6, recovering only briefly in 2010 and 2011, largely due to the Governments fiscal stimulus.
It has been in slow and steady decline ever since. By June 2019 it had reached 99.7. The first time in 40 years it has been below 100 outside a recession.

How should we interpret that decline?
It clearly confirms the fact our current economy and labour market are weak. The Governments crowing about the number of jobs created is largely a reflection of the level of net overseas migration which by the way is now falling and well below the 2019 Budget forecast.
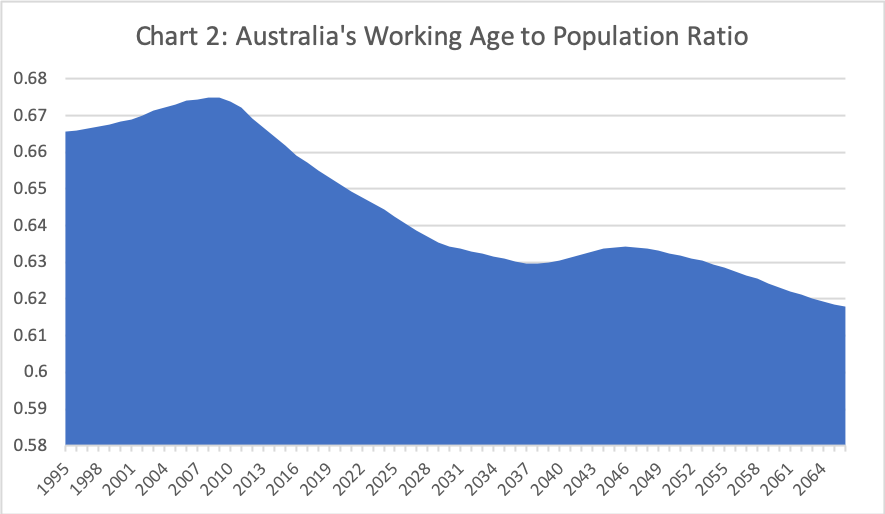
But does it also reflect the fact Australias working age to population ratio peaked around 2008-09 and has been declining ever since (see Chart 2).
If it is, amongst other factors, a reflection of the impact of population ageing, will this indicator continue to deteriorate. There will undoubtedly be periods in the future when the economy strengthens and the average number of hours worked per month per adult will rise.
The impact of ageing, however, will be relentless.
It is time we once again started to think about how we are going to manage our economy and our society with an ageing population.
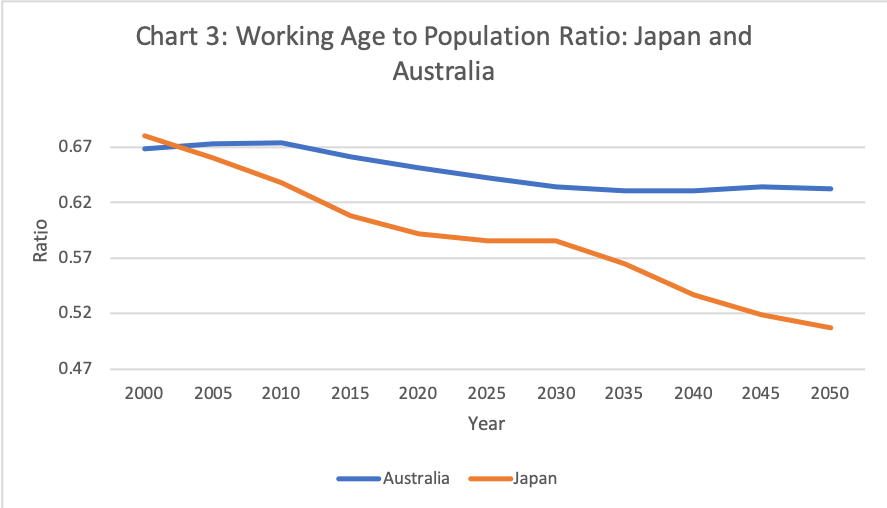
We can take comfort in the fact our population will not age as rapidly as most other developed countries, particularly countries in Europe as well as in East Asia (ie Japan, China, Korea). See Chart 3 for a comparison of our rate of ageing with that of Japan.

Australia will age more slowly predominantly because of our immigration program.
However, as an economy heavily dependent on international trade, it would be a mistake to think we will be immune from the impact of population ageing.
Treasurer Josh Frydenberg has the opportunity in the next Inter-Generational Report due in May this year to lay out a plan for how Australia will manage the impact of ageing.
He could squib the challenge by repeating the fantasies in his 2019 ten year budget plan. Or he could be honest with us and give us a genuine plan for our future.
AbulRizvi was a senior official in the Department of Immigration from the early 1990s to 2007 when he left as Deputy Secretary. He was awarded the Public Service Medal and the Centenary Medal for services to development and implementation of immigration policy, including in particular the reshaping of Australias intake to focus on skilled migration. He is currently doing a PhD on Australias immigration policies.
