China's scientific research output soars
January 1, 2021
China’s rapid ascent within the world of scientific research as got other leading nations on the edge of their seat.
In discussion of what makes a country powerful attention is usually given to its military might and to the size of its economy. Each of these gives heft and examining detail and each case is even more informative: the structure of military power and nature of an economy.
Data is available for both and is frequently discussed with the US having overwhelming military strength (though to what effect is questionable when looking at outcomes in recent conflicts) and China accepted as about to become the largest economic power if it has not done so already. “Soft power”, another element in asserting a country’s influence, is rather harder to quantify. Too often ignored are the education and research bases that to a significant extent underlie economic and military prowess and, in a less direct manner soft power as well.
Colin Mackerras (P&I Sept 9) provided important information on the rise of China’s universities, while at least the basic information on school performance as assessed by the OECD’s Program for International Student Assessment (PISA) is well known.
A couple of points worth mentioning in passing are that (a) while Australians see China as a source of international students not many are aware that it is also a destination for international students, and on a scale similar to Australia, and (b) the widespread conception of Chinese education as being all ‘rote learning’ is misplaced.
Primary school education has been significantly reformed while pressures to extend that to secondary are resisted in large part owing to the importance of the _gaokao (Higher Education Entrance Exam) with change slowly happening. Despite the cramming and rote learning, it is not necessarily at the expense of understanding. Though the PISA results are most often viewed on the basis of the average grade obtained by 15-year-olds in each jurisdiction, looking deeper is instructive. To take just one example from PISA 2018 - the highest mean score for mathematics of 591 was for students in the four participating Chinese provinces (OECD average 489, Australia 491) but the often overlooked detail is that 44% of the Chinese students were in the highest two achievements bands (“_high level of conceptual understanding and mathematical reasoning” and better) while the OECD average was 11% (Australia 10%).
Such educational background sets the foundation for research where, contrary to a still prevalent Australian view of China as a place of imitators and cheap labour, China is now a global leader. In a comment to Mackerras’ article Godfree Roberts supplied a chart of 2019 “Journal Publications” in a number of disciplines. I thought it would be useful to expand on this with more detail; the breadth and time series shows both the extent of Chinese research and the rapidity of its growth.
SCImago Journal & Country Rank is a portal to Elsevier’s Scopus database from which one can retrieve (among other things) the number of papers appearing in peer-reviewed journals, categorised into 27 thematic areas (and 300+ subcategories) and grouped by country and year of publication. As there is a very large amount of data, just a small indicative sample is given below. One way to look at where research is being done is to look at “country rankings” - based on the number of papers published from each country in a particular year. The following three tables give a brief summary for the “top ten”:
| All Fields | |||||
| Rank | 1996 - 2019 | 1996 | 2007 | 2019 | |
| 1 | United States | United States | United States | China | |
| 2 | China | United Kingdom | China | United States | |
| 3 | United Kingdom | Japan | United Kingdom | United Kingdom | |
| 4 | Germany | Germany | Germany | India | |
| 5 | Japan | France | Japan | Germany | |
| 6 | France | Canada | France | Japan | |
| 7 | Italy | Italy | Canada | Italy | |
| 8 | Canada | Russian Federation | Italy | France | |
| 9 | India | China | Spain | Canada | |
| 10 | Australia | Australia | Australia | Russian Federation | |
| Year 2000: USA 28% of global total, China 3.9% | Year 2019: USA 16.2% of global total, China 16.4% | ||||
| Physics and Astronomy | |||||
| Rank | 1996 - 2019 | 1996 | 2007 | 2019 | |
| 1 | United States | United States | United States | China | |
| 2 | China | Japan | China | United States | |
| 3 | Germany | Germany | Japan | Russian Federation | |
| 4 | Japan | Russian Federation | Germany | Germany | |
| 5 | Russian Federation | France | France | India | |
| 6 | France | United Kingdom | United Kingdom | Japan | |
| 7 | United Kingdom | China | Russian Federation | United Kingdom | |
| 8 | Italy | Italy | Italy | France | |
| 9 | India | Canada | South Korea | Italy | |
| 10 | South Korea | India | India | South Korea | |
| Year 2000: USA 21% of global total, China 5.4% | Year 2019: USA 11.3% of global total, China 20.6% | ||||
| Biochemistry, Genetics & Molecular Biology | |||||
| Rank | 1996 - 2019 | 1996 | 2007 | 2019 | |
| 1 | United States | United States | United States | China | |
| 2 | China | Japan | China | United States | |
| 3 | Japan | United Kingdom | Japan | Germany | |
| 4 | United Kingdom | Germany | United Kingdom | United Kingdom | |
| 5 | Germany | France | Germany | Japan | |
| 6 | France | Canada | France | Italy | |
| 7 | Italy | Italy | Canada | India | |
| 8 | Canada | Spain | Italy | France | |
| 9 | India | Netherlands | Spain | Canada | |
| 10 | Spain | Australia | India | South Korea | |
| Year 2000: USA 30.1% of global total, China 2.0% | Year 2019: USA 18.4% of global total, China 18.3% | ||||
The pattern is similar for other fields though details differ to some extent - the particular countries in ‘top ten’ and the year in which China gains top position (as a generalisation Australia is commonly around the fifteenth position). It is only in the “Arts and Humanities” category that Chinese research output doesn’t rank near the top (reflected somewhat in the “All Fields” figures) The extent and rate of change in scientific output is more clearly seen in plots showing the annual number of papers for each country over the past two decades. To keep these simple the following examples just show the plots for the two leading countries: USA and China:
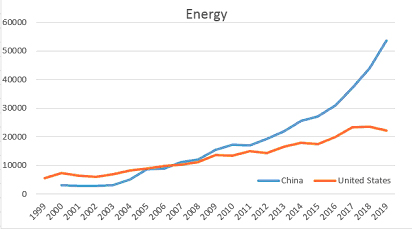
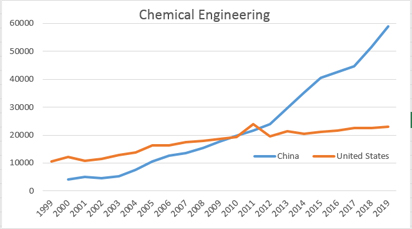
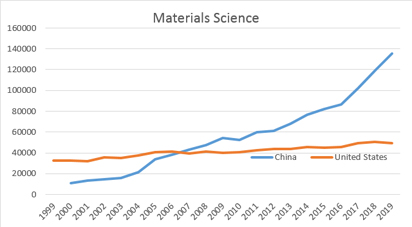
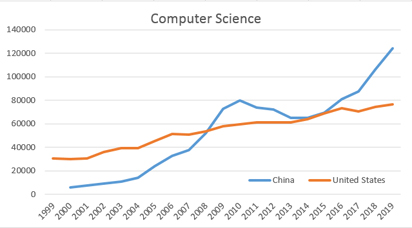
There is similar variation among most of the remaining ‘thematic areas’ and numerous sub-categories but the general pattern is the same, with the striking exception of “Arts and Humanities”:
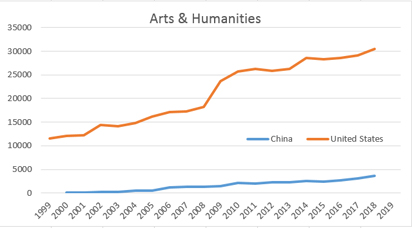
| Shares of global total:Year 2000: USA 41.3 % China 0.4%Year 2019: USA 22.2% China 3.1 %2019 Country rankings | ||||
| 1 | United States | 6 | Italy | |
| 2 | United Kingdom | 7 | Australia | |
| 3 | Germany | 8 | Canada | |
| 4 | Spain | 9 | France | |
| 5 | Russian Federation | 10 | China | |
Of course, the mere number of papers published takes no account of the quality or significance of the research but, as with the continuing denial of the worth of the Chinese PISA results, it is self-delusional to contend that all is ‘rote’/low quality.
Three other indicators of particular current relevance are worth brief mention:
(a) On WHO’s listing (22/12/2020) of COVID 19 candidate vaccines five of the 14 in phase 3 trials have been developed in China.
(b) In the development of clean energy sources it is well known that for several years the largest installer of wind and solar has been China. The IEA predicts 40% of additional global renewables through to 2024 will be in China, most wind and solar. Given the intermittency issues with those sources perhaps the more important development is the bringing online of that country’s 49th nuclear power plant Tianwan 5 (56 months after construction started), the progress towards the world’s first Generation IV reactors being built at Shidao Bay as well as the theoretical and engineering work on fusion reactors.
(c) Following the Trump administration’s actions against Huawei, banning not just its import of US chips but of chips manufactured anywhere using US technology, severe consequences have been predicted for the company - even its demise. A June 14 Asia Times article summarises why this thinking is misplaced and mentions the collateral damage to US manufacturers. Chinese market-based planning - cheaper to import chips than build local manufacturing capacity - has created short term supply problems for Huawei but accelerated the effort for totally Chinese chip design and fabrication. This has been played out previously with supercomputers, as seen in biannual lists of the world’s 500 fastest computers, showing the number of machines per country and their rankings within the top 500.
Chinese computers in Top 500, June of each year
| 2000 | 2002 | 2004 | 2006 | 2008 # | 2010 | 2012 | 2014 | 2016 | 2018 | 2020 | |
| Number | 2 | 3 | 14 | 28 | 12 | 24 | 68 | 76 | 167 | 206 | 226 |
| Best rank | 280 | 192 | 10 | 35 | 112 | 2 | 1 | 1 | 1 | 2 | 4 |
| # but November 2008: 15 machines, rank 11 | |||||||||||
Most computers in the top 500, from all countries, use the USA made chips. Such was the case for the Chinese machine that ranked number 1 in 2012. In 2015 the US banned the export of high-end chips to China. However the country had anticipated such action and several years earlier began work on an indigenous chip - which was used in the machine topping the 2016 list.
The US has made clear that their primary concern is neither China’s military nor economic issues (including bilateral trade) but concern to ‘maintain US scientific and technological dominance’. A challenging task.

