Environment: burning wood in power stations doesn’t help the climate
July 21, 2024
The living, not our forebears, have put most of the CO2 into the atmosphere. Substituting wood for coal in power stations doesn’t reduce CO2 emissions. A little warmth helps bell frogs fight chytrid fungus.
Wood for coal trick
The national delegates at the Glasgow COP meeting in late 2022 agreed to ‘phase down unabated coal power’. That was the best they could do. Not ‘phase out rather than ‘phase down. Not ‘all coal’ rather than ‘unabated coal’.
Abatement in this context generally refers to the application within coal-fired power stations of carbon capture and storage (CCS). Power stations that use abatement still emit considerable amounts of CO2 and there are the added problems that CCS is a technology that has proven difficult to apply at scale, is very expensive and uses large amounts of power itself.
Whatever … after the failure of the previous 25 COPs to recognise even the existence of fossil fuels, let alone their principal role in causing climate change, I suppose you could, had you taken an overdose of happy pills, conclude that ‘phase down unabated coal power’ was a promising development in the world’s efforts to control global warming.
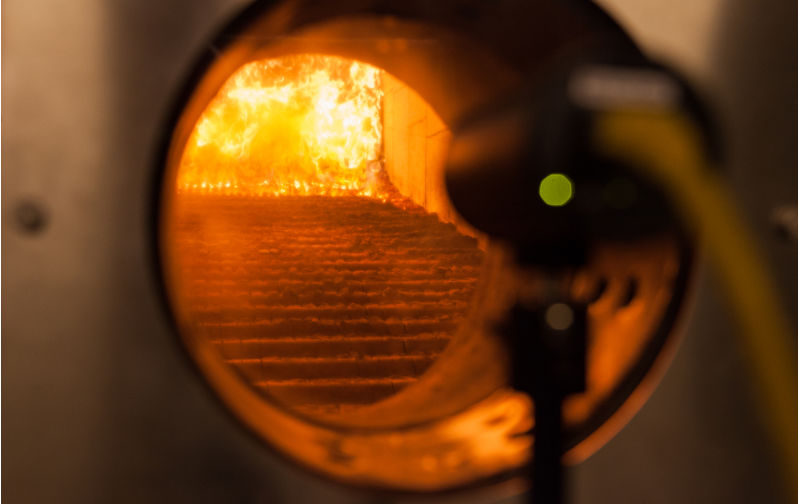
Unfortunately, some countries also have another trick up their sleeves. They expand the definition of abatement to include replacing some of the coal burnt in power stations with wood – a process known as co-firing.
When wood is burnt, it emits roughly the same amount of CO2 as coal. However, a loophole in the international rules for calculating national CO2 emissions results in the emissions from burning wood in power stations not being counted in the power sector’s emissions. Rather, they are counted in the land use emissions. The measurement of land use emissions is very dodgy and open to lots of interpretation and fudging at the best of times, meaning it’s easy to lose the burnt wood’s emissions in the land use sector’s mess.
But it gets worse, if the wood burnt has been imported, the emissions are counted in the land use emissions of the country the wood came from. Hey presto, the power stations are emitting just as much CO2 as when they burnt 100% coal but only a fraction of their emissions are counted by the power sector and the nation that does the burning. Plus, forests and the habitats they provide have been destroyed and biodiversity further threatened by the logging.
Notable perpetrators of this lurk are UK, Japan and South Korea, all of which have ample capacity to do better – shame on them. Indonesia and Vietnam are also culprits - they would be better off investing in renewable energy to power their economic development.
The demand for the wood pellets that go into power stations is expected to almost treble between 2017 and 2027 to 36 million metric tonnes. The countries that log the trees and export the pellets are equally culpable in this sleight of hand. The USA, Russia and Canada are the main producers but Australia is fast becoming a significant contributor, as are countries with tropical forests such as Brazil, Mozambique, Vietnam, Malaysia and Indonesia.

Basically, it’s a conspiracy of many nations’ politicians and bureaucrats to obfuscate their nation’s true emissions so that they, and their fossil fuel mates, can carry on with business as usual while appearing to be doing something about climate change. Most crimes against humanity are really crimes against a bit of humanity (John Donne aside for a moment). Perpetuating climate change is a crime against the whole of humanity.
CO2 emissions 1850-2022
The graph below shows the annual emissions of CO2 in Megatons (MtCO2) from 1850 to 2022 by region of the world.

Three issues stand out:
- There was steady but relatively slow growth in total emissions during the hundred years between 1850 (204 Mt, of which the UK emitted 60%) and 1950 (6573 Mt) – an increase of about 65 Mt per year.
- Emissions started to increase rapidly after WWII and by 1975 the world was emitting about half of what we currently emit each year.
- Between 1950 and 2022 the increase in emissions averaged about 420 Mt per year.
This demonstrates that although we talk about the fossil fuel era beginning with the Industrial Revolution in the mid 18th century, the world took 200 years to go from zero to half of our current annual emission rate and less than 50 years to increase from half to 100%. It wasn’t our Victorian and early 20th century forebears who have created the climate crisis, it is us, the generations alive since the mid 20th century.
The next graph is similar but shows cumulative rather than annual emissions. Although the East Asia and Pacific region is now the largest annual emitter, Europe and Central Asia and North America have still pumped the most CO2 into the atmosphere, although maybe not for much longer. The countries in these three regions (although not all of them) share the responsibility for the pickle we’re in. The four regions at the bottom of the graph have collectively emitted only 255 MtCO2.

The next three graphs (snapshots from an animated sequence in the link) show for 1950, 1975 and 2022 the total CO2 emissions for that year and the emissions of each of the ten major emitting countries. The emergence of the USA, then China and more recently India as the major emitters reflects their industrialisation and growing economic heft.
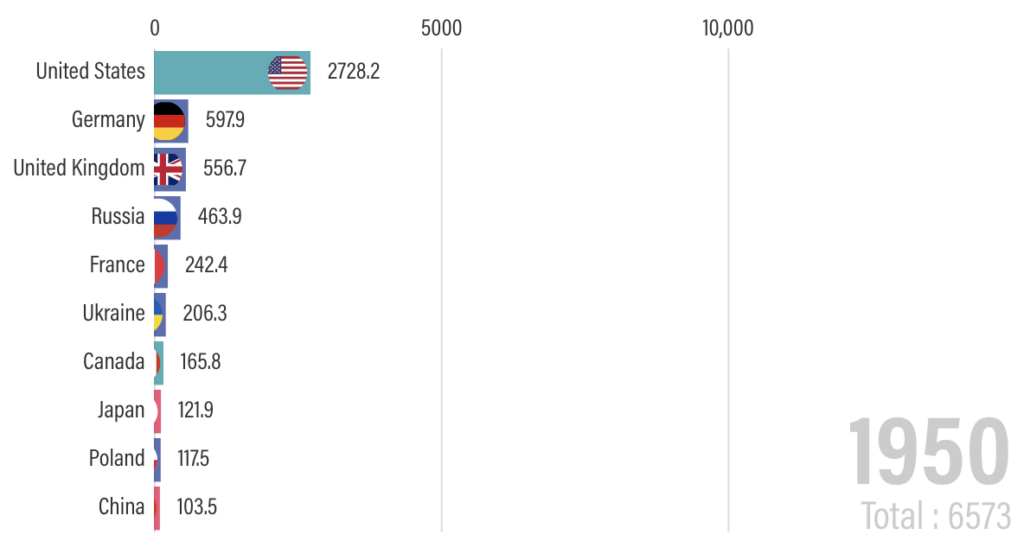
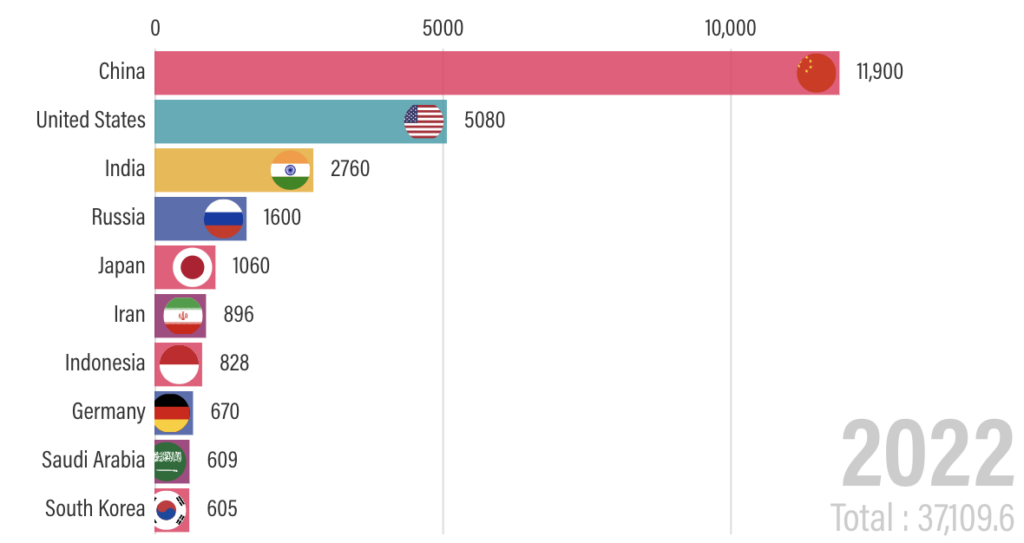
For me, these graphs present a crystal-clear picture of the emergence of our climate change problem and who is and is not responsible for it.
Why is this fern in the Guinness Book of Records?
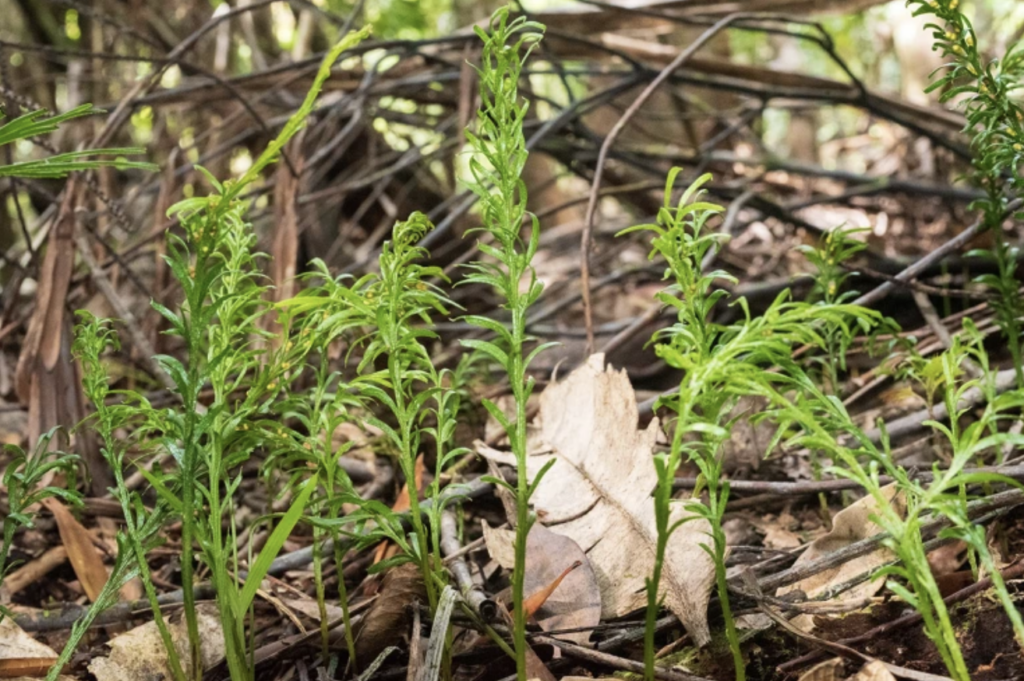
Photo: Pol Fernandez
These small green plants are Tmesipteris oblanceolate, a type of fork fern that lacks true roots and true leaves. It is native to New Caledonia and Vanuatu and grows to about 15cm.
This apparently unspectacular plant has one spectacular, and to my mind highly unlikely, attribute. Any ideas?
Glencore’s plan to increase Hunter Valley coal production
Glencore’s Hunter Valley Operations (HVO) coal mining project in the upper Hunter Valley currently consists of two open-cut mines separated by the Hunter River. Glencore is now seeking approval from the NSW Government to extend the life of the mines for another 25 years. This will produce 500 million tonnes of coal and 1.2 billion tonnes of greenhouse gases. It will also destroy 400 hectares of native forest, use almost 8,000 megalitres of water per year and generate lots of local air pollution.
Lock The Gate has obtained a copy of an extremely illuminating two-minute video extolling the virtues of the proposal to the NSW Government.
So what is so special about Tmesipteris oblanceolate?
First, a biology refresher. A genome is the complete set of genetic material (DNA) that is specific to every individual species. ‘Base pairs’ are the fundamental chemical building blocks of DNA. Each base pair is shaped like a dumbbell with each end representing one the two nucleotide bases that are linked (paired) together by a chemical bond. A DNA molecule consists of lots and lots of these dumbbells, sorry base pairs, stacked on top of each other like a ladder, to mix my metaphor.
Back to the question.
Tmesipteris oblanceolate has the largest genome of any animal, plant, fungus, anything ever discovered, consisting of 160 billion base pairs. Our own genome has a paltry 3 billion base pairs.
Why, one might ask, does a small, non-flowering plant have fifty times more genetic material than us wonderful humans? How much of it actually does anything? If lots of the base pairs are redundant, why waste so much energy reproducing them? Mysteries of evolution.
Fortress for fungally-freatened frogs

The fungal disease chytridiomycosis (or chytrid) has led to the extinction of at least 90 species of frogs worldwide and caused the population sizes of around 500 others to plummet. The fungus responsible for chytrid thrives in cooler conditions and this has prompted a novel approach to both preventing and curing the disease in Australia’s threatened, green and golden bell frog which, crucially, happens to quite like a bit of warmth.
To solve a froggy health crisis, the bell frogs were provided with cosy accommodation in the form of bricks with holes in them stacked inside small greenhouses. The added warmth inside the holes proved to be popular with the threatened frogs and the 6oC increase in temperature within the snug homes was enough to reduce the virulence of the fungus and the incidence of disease. In an added bonus, frogs that did get infected and survived had less serious problems if subsequently reinfected.
This is a simple, low tec way to help restore the bell frog’s numbers that anyone with a garden can implement. It won’t work with all frog species though as not all of them seek out warmer temperatures.
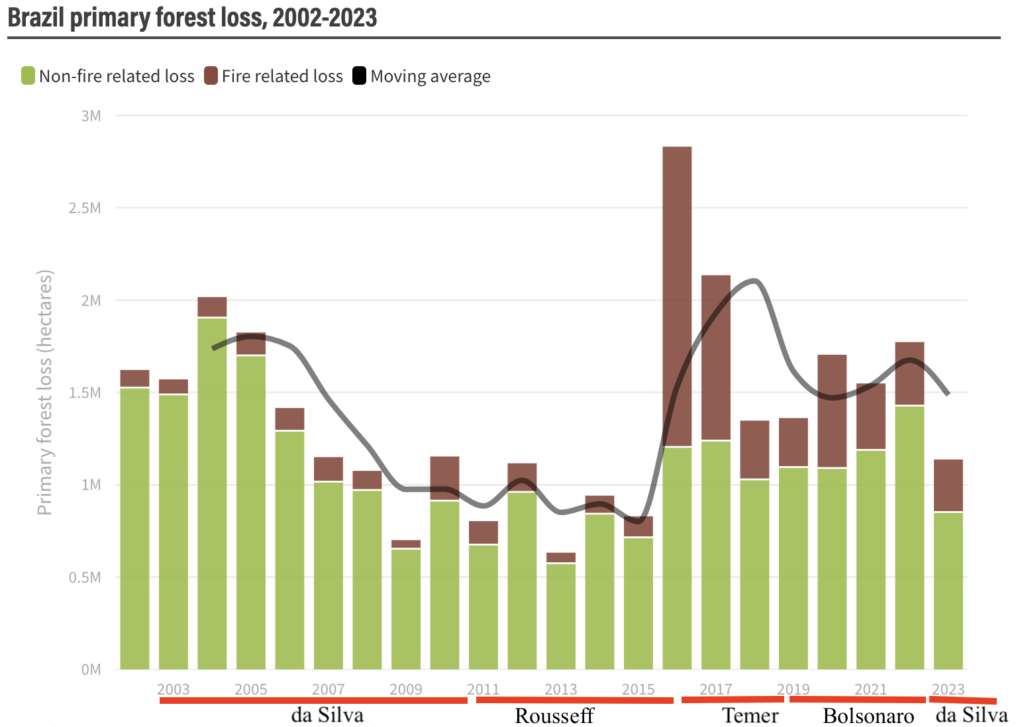
Forest loss in Brazil
As Paul Keating famously said, ‘When you change the government, you change the country’. The pattern of forest lost in Brazil over the last 20 years seems to confirm Paul’s wisdom – see the histogram below to which I have added the periods in office of the various presidents.
Fire related loss may appear to be beyond the control of any particular government but that’s not correct as it is often lit intentionally when forests are cleared for agriculture, mining and logging. Whatever forest remains after clearing is also more vulnerable to a subsequent fire.
