Environment: Critical months ahead for Australias environmental legislation
August 5, 2023
Australias environmental protection legislation needs all hands-on deck right now. City centre households have lower emissions than the suburbs. Northern hemisphere summers getting hotter.
Environmental Protection and Biodiversity Conservation (EPBC) Act review
Regular readers of my Sunday contributions will be aware that I consider climate change and the loss of biodiversity to be not the only but certainly the most urgent problems threatening the integrity of the environment upon which human health, civilisations and even existence depend. Climate change and loss of biodiversity are global problems that require greatly increased, coordinated global action. This can seem overwhelming.
Over the next few months, however, Australia has an enormous opportunity to make a major contribution to slowing climate change and biodiversity loss, principally in Australia but also worldwide. An opportunity that is entirely within Australias control.
The EPBC Act is the legislation that provides the framework for the Federal governments actions to protect (or not) Australias natural environment. The legislation requires that the Act be reviewed every ten years and in 2019 the previous government asked Graeme Samuel to conduct the most recent review. Samuel conducted a thorough review and concluded that the Act has many deficiencies and is not fit for purpose. The Morrison government sat on Samuels report and recommendations for 18 months before being kicked out in May 2022. No surprise there.
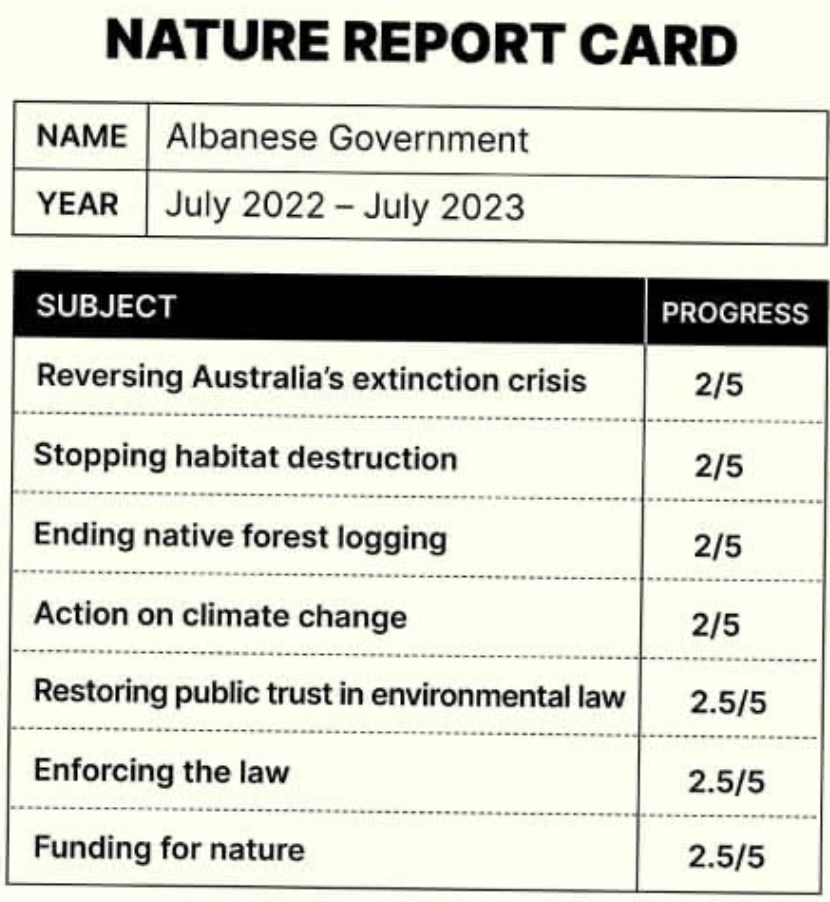
The Albanese government is currently preparing its response to the Samuel review and Minister Plibersek has made encouraging remarks about the need for an effective Act. That said, what we know of the governments current intentions is not wholly encouraging nor is its actual performance. For example, the Australian Conservation Foundation has prepared a Nature Report Card examining the governments performance on seven criteria over the last twelve months. Unfortunately, despite some good promises, the governments actual progress to date, as the snapshot below shows, doesnt even scrape a pass.
The Environmental Defenders Office has prepared a three-page guide of what needs to happen to ensure that we get an effective, well resourced, fit for purpose EPBC Act. They make eight points:
- We have a short, critical window to ensure that the law achieves good outcomes for nature and the climate (e.g. no more extinctions, protection of the Great Barrier Reef);
- Outcome-focused national environmental standards with strong legal protections are required to halt the destruction of nature and protect critical habitats and at-risk species;
- A well-resourced, fully independent Environmental Protection Authority would be best placed to make decisions about the environment;
- Rights of First Nations communities must be central to the operation of the new Act;
- Stronger community rights and consultation standards are needed to restore public trust in environmental laws;
- Biodiversity offsetting has enormous risks for nature and should be allowed in only very limited circumstances;
- Climate change and environmental protection go hand in hand and the new Act must contain a climate trigger to prevent new projects that would exceed carbon budgets and targets and undermine our ability to keep global warming under 1.5oC;
- To protect our water and forests, the water trigger in the current Act should be expanded to cover fracking and the exemption of Regional Forest Agreements from the EPBC must be removed.
This is a once in a generation opportunity to make our national environmental laws effective. What isnt put right now, wont be corrected for at least another ten years. Getting the best outcome from Graeme Samuels work and the review of the EPBC Act must be a top priority (even the top priority) for the next few months for anyone interested in protecting Australias environment and combating climate change.
The one thing we can be sure of is that vested interests - miners, (some) farmers, developers, etc. will be in Pliberseks ear continually, telling her how every proposed improvement to environmental protection will destroy the economy, destroy jobs, reduce competitiveness, reduce investment, create unnecessary red tape, stop Australia retaining the Ashes in 2026.
I strongly recommend the EDOs Urgency and ambition more important than ever for national nature law reform if youd like to know about this issue. I also strongly encourage you to let your local Labor and Greens MPs know that you support strong legislated environmental protection. Dont waste your time trying to convince the Liberals or Nationals.
City centre households have lower emissions
As Ive discussed previously, wealthier people tend to have higher greenhouse gas emissions than poorer people they buy more stuff and travel a lot more, particularly on planes. You might expect, then, that the denizens of Manhattan, who have something of a reputation for extravagance, would also have a larger climate footprint than their suburban and country cousins. But youd be mistaken.
As the two maps below demonstrate, the emissions per household in Manhattan and adjacent suburbs are relatively low (the green and pale areas with emissions per household in the range of 10-40 tons of CO2e per year) compared with the Lower Hudson Valley, Long Island, New Jersey and Connecticut (the increasingly dark orange areas with emissions of 50-80 tons of CO2e per year).
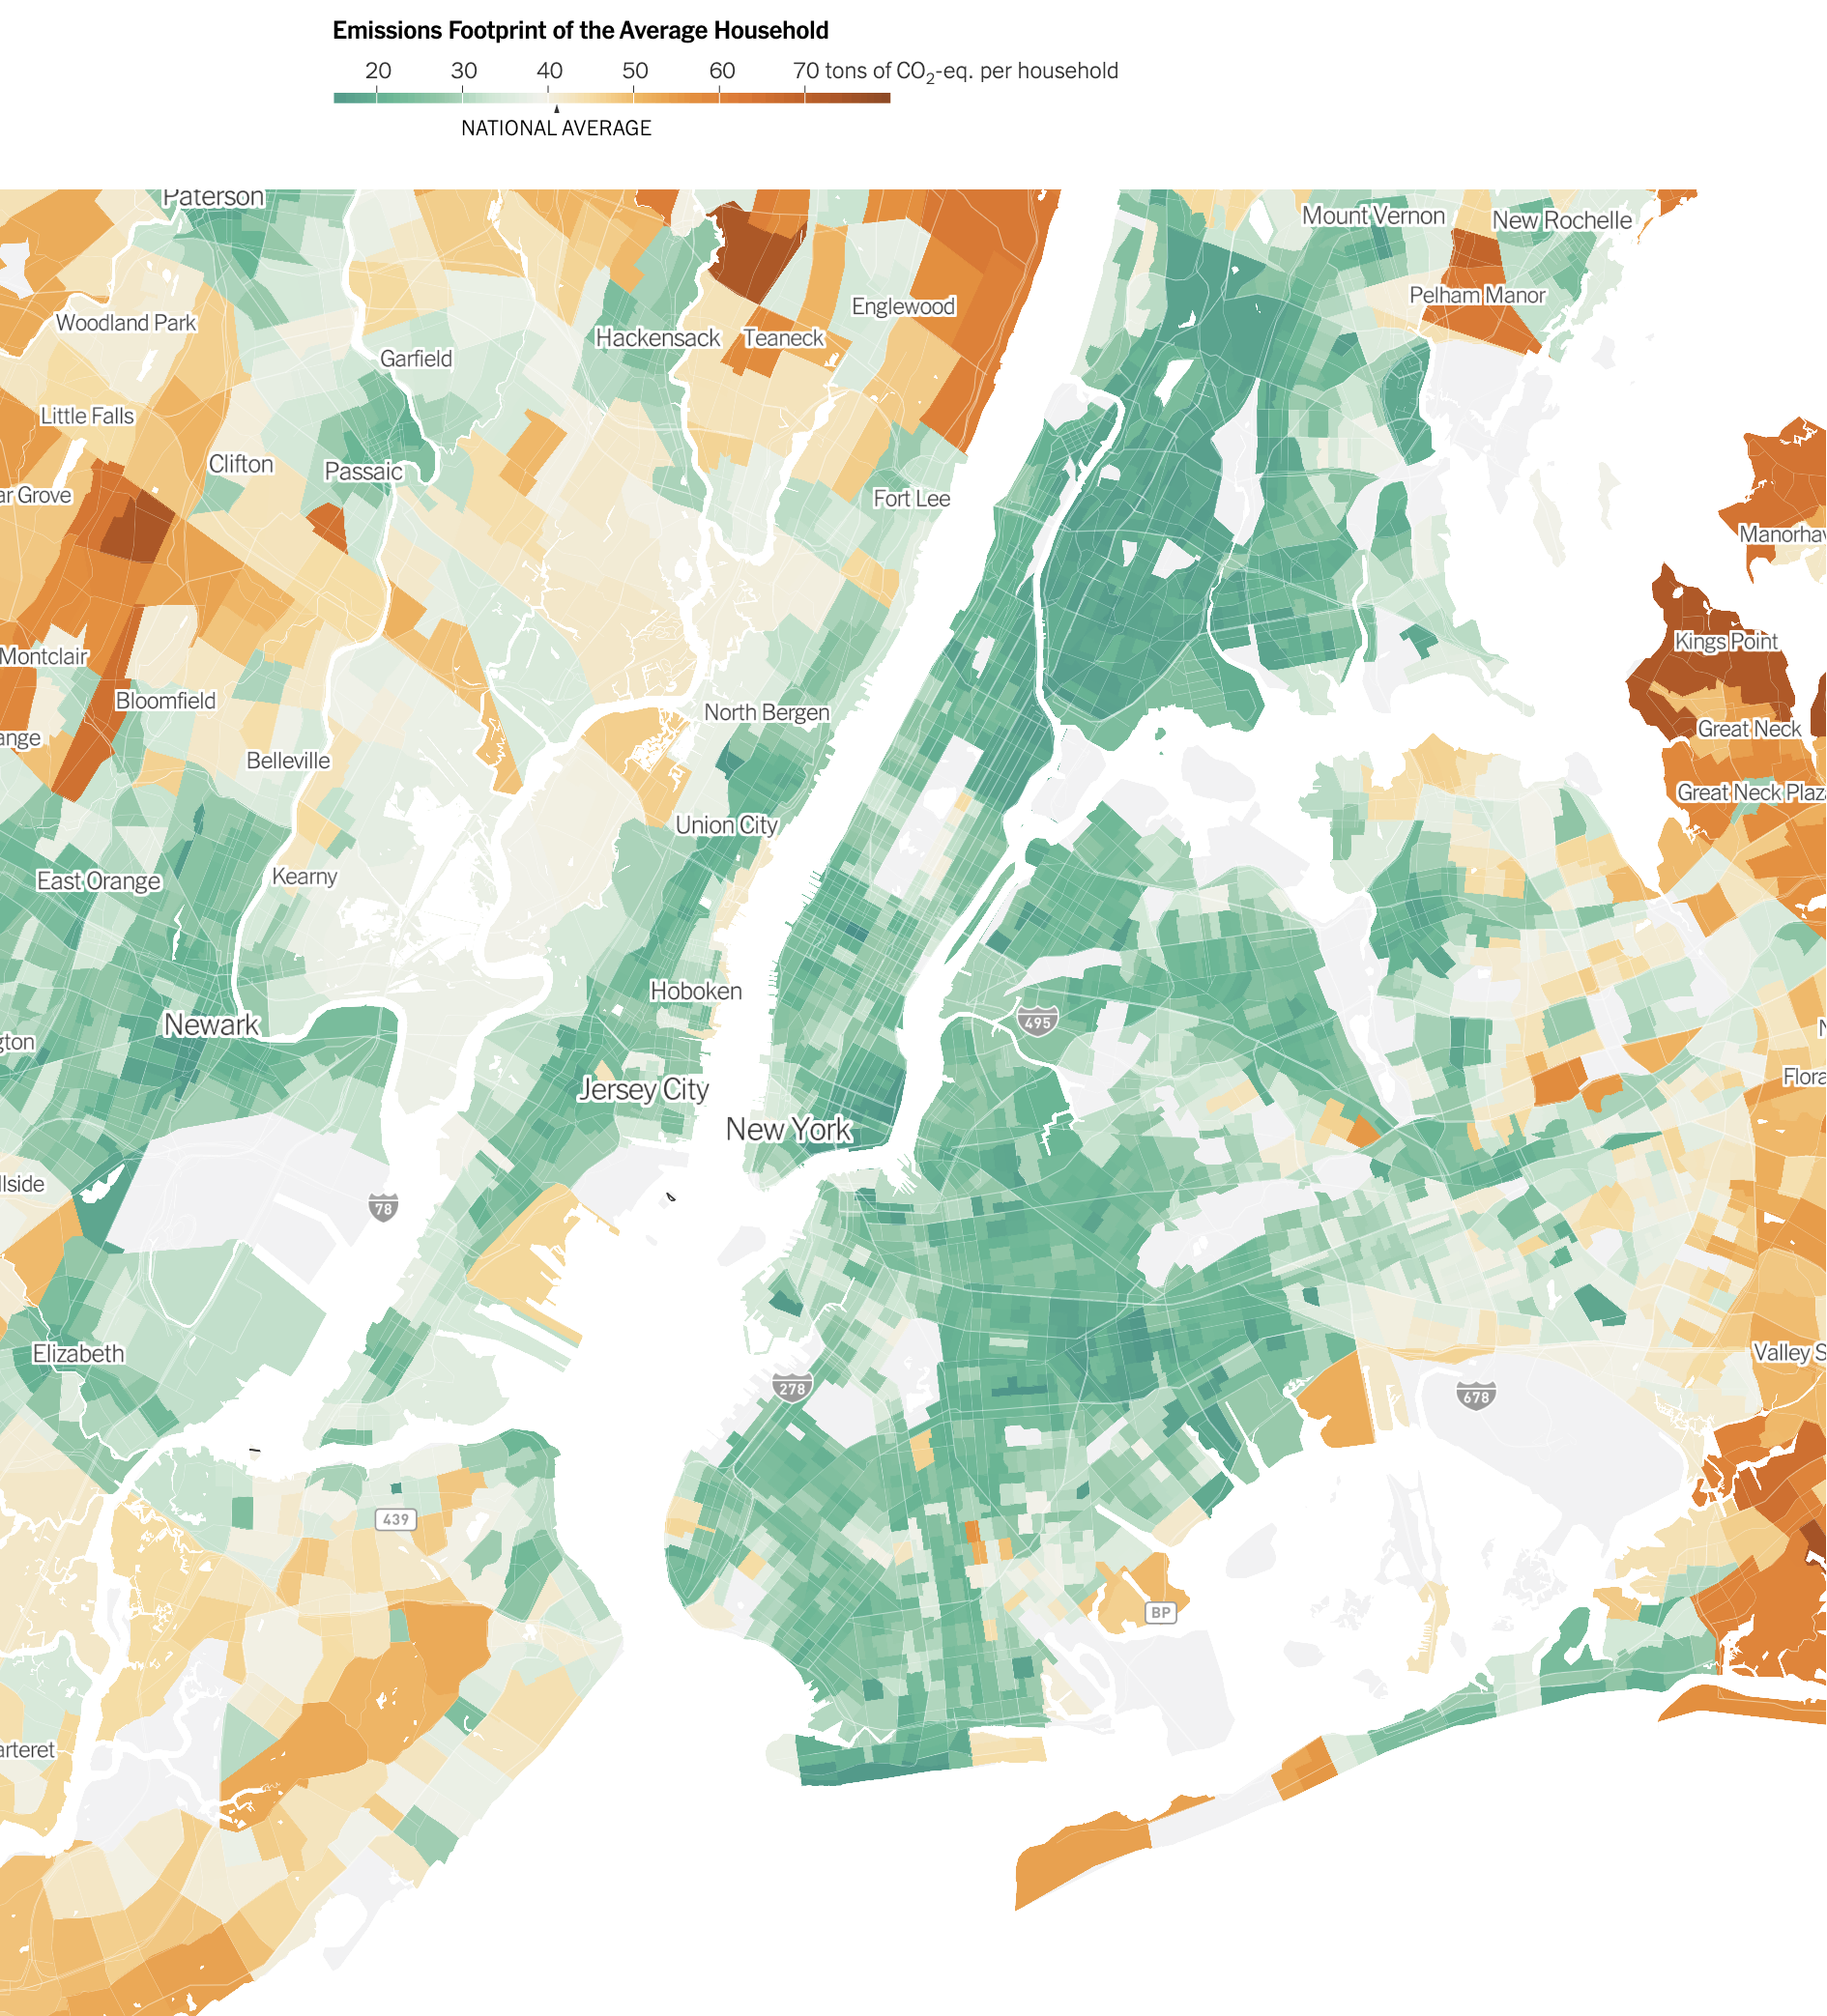
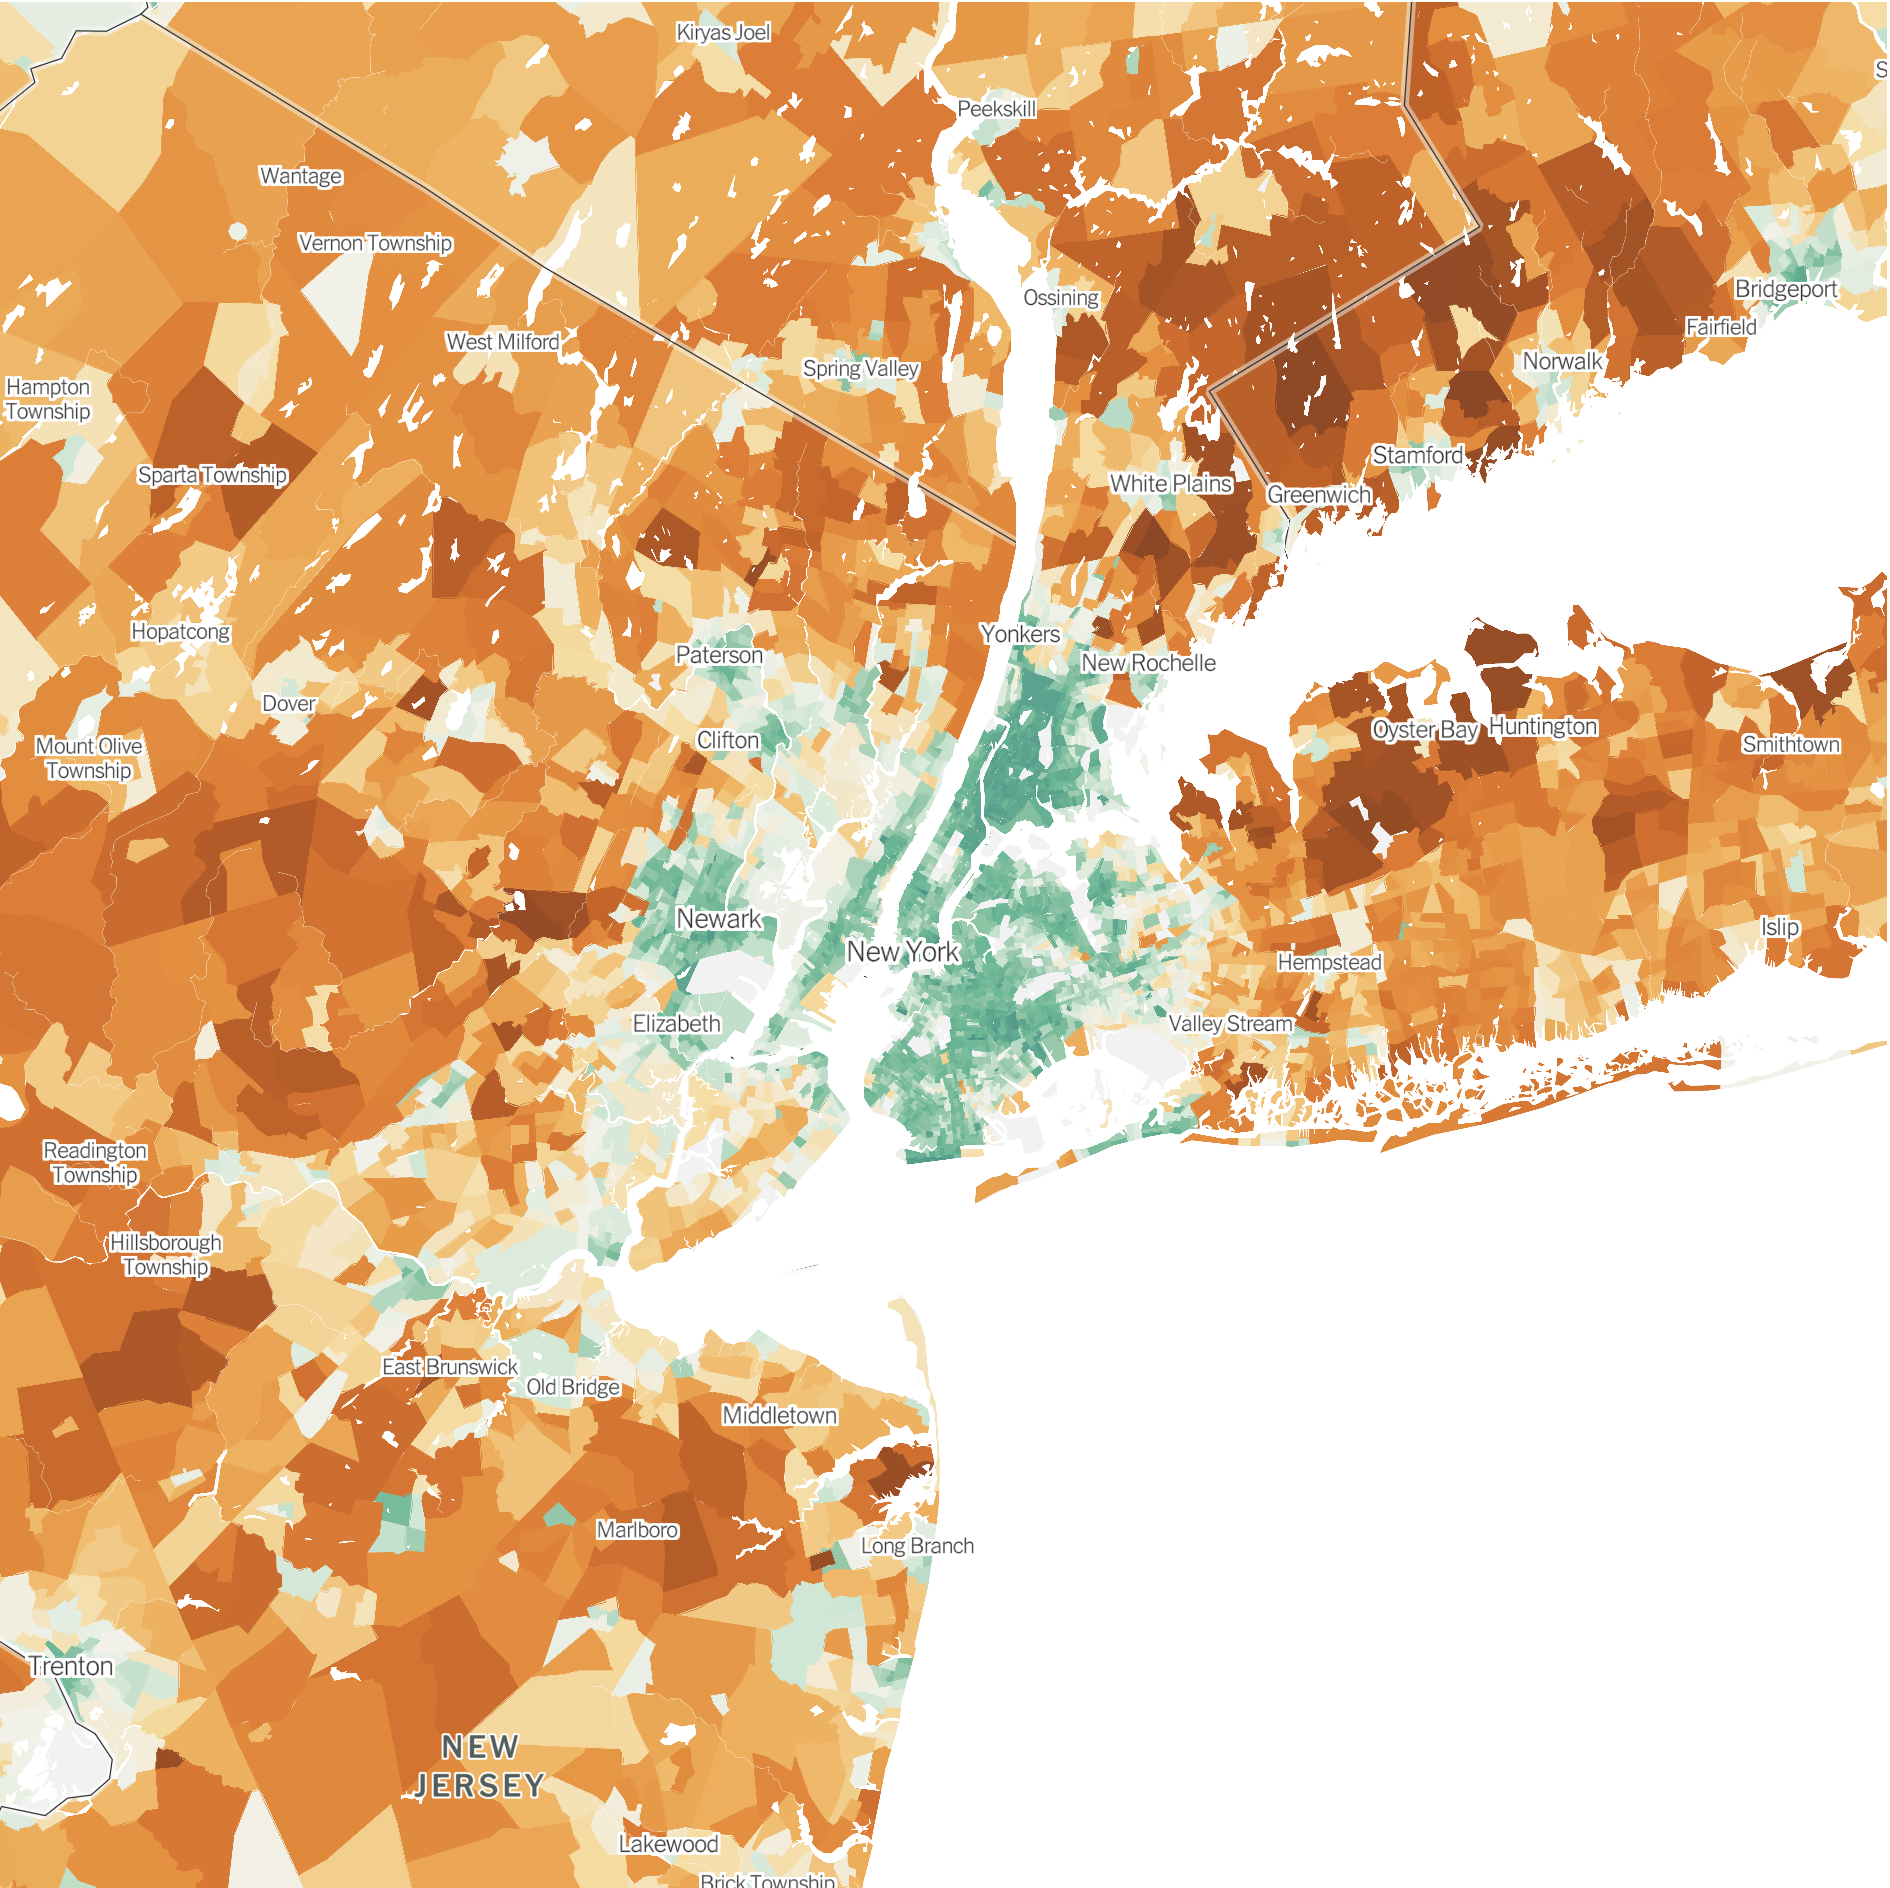
As a broad generalisation, homes in denser neighbourhoods close to city centres have lower emissions because they are smaller, require less energy to heat and cool and benefit from good public transport to close-at-hand services and amenities. By contrast, homes in the suburbs and country tend to be larger and residents drive private vehicles to services that are further away.
But this doesnt mean that Carrie, Samantha, Miranda, Charlotte and friends are low carbon emitters. The average household size in Manhattan is two persons. If we assume average Manhattan household emissions of 25 tons of CO2e per year, that is still 12.5 tons per person per year, well above Europes and Chinas 7-8 tons and Indias and Africas 2 tons. The global average needs to be about 3 tons per person per year to have a long-term stable climate.
Electric motorbikes
Duncan Mallord from Adelaide has entered the Guinness Book of Records for claiming the world record for the highest climb on an electric motorbike. He rode his Harley Davidson Livewire the 1900 kilometres from Lake Eyre (Kati Thanda) to the top of Mount Kosciuszko in 102 hours, including stops for charging.
We hear a lot about EVs, e-bikes and e-scooters but not so much about e-motorbikes. Apart from scaling Australias highest peak, here are six reasons why youre going to hear a lot more about them (but thankfully when they are in the hills, not from them):
- Fewer moving parts gives more reliability
- More comfortable: avoids the hot sun and hot bike problem
- No need to focus on getting the clutch and gears right
- Much less maintenance
- Smooth performance
- The quiet good for the rider, the neighbours, pedestrians and wildlife.
Not just this year that the northern summer is hotter
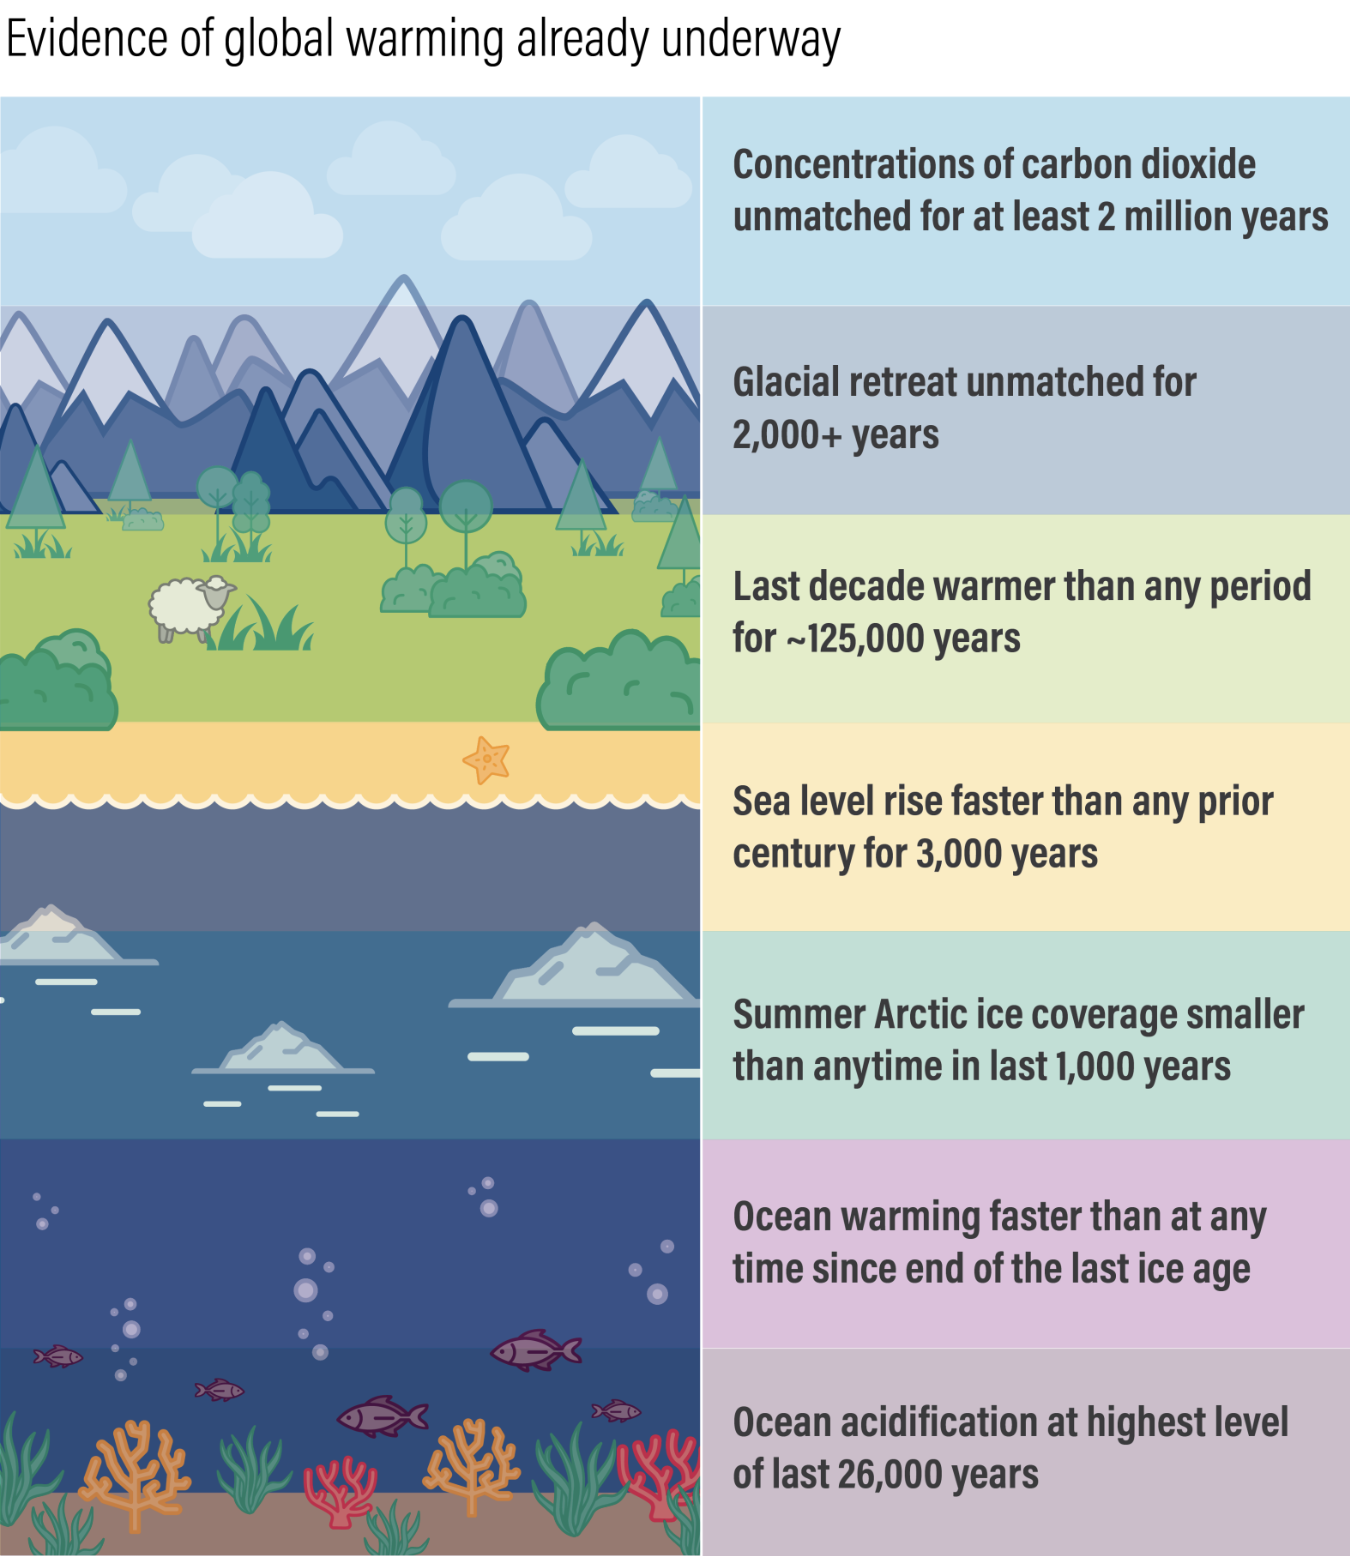
The extremely high temperatures and forest fires across the northern hemisphere in recent months have garnered much attention. No one should be under any illusion that this is a one-off event, however.
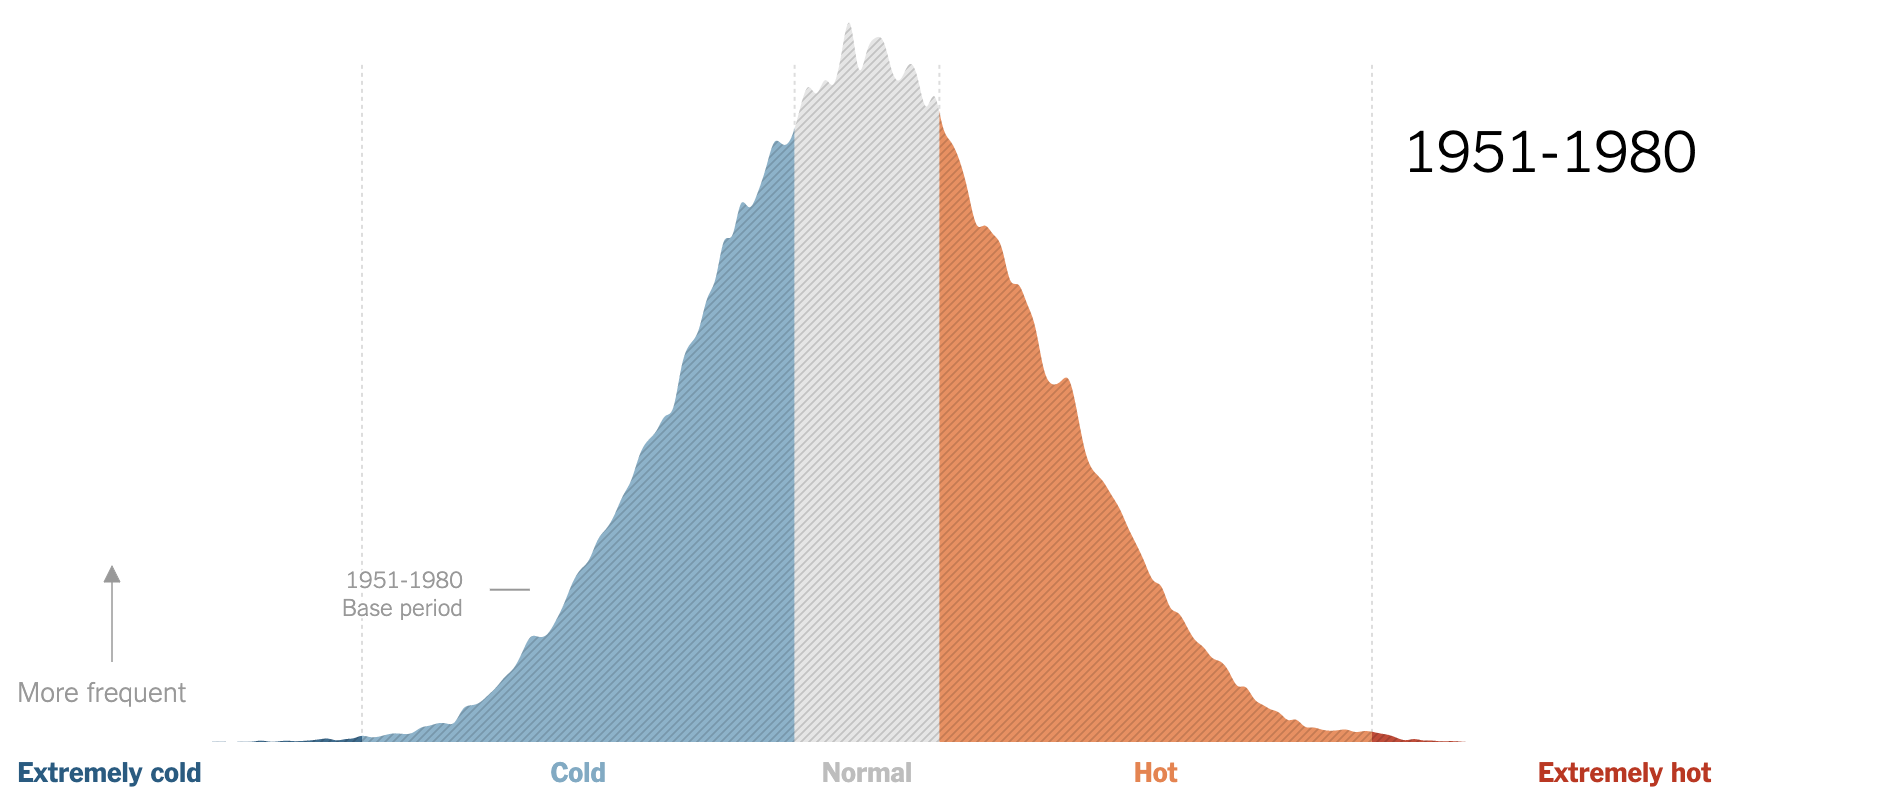
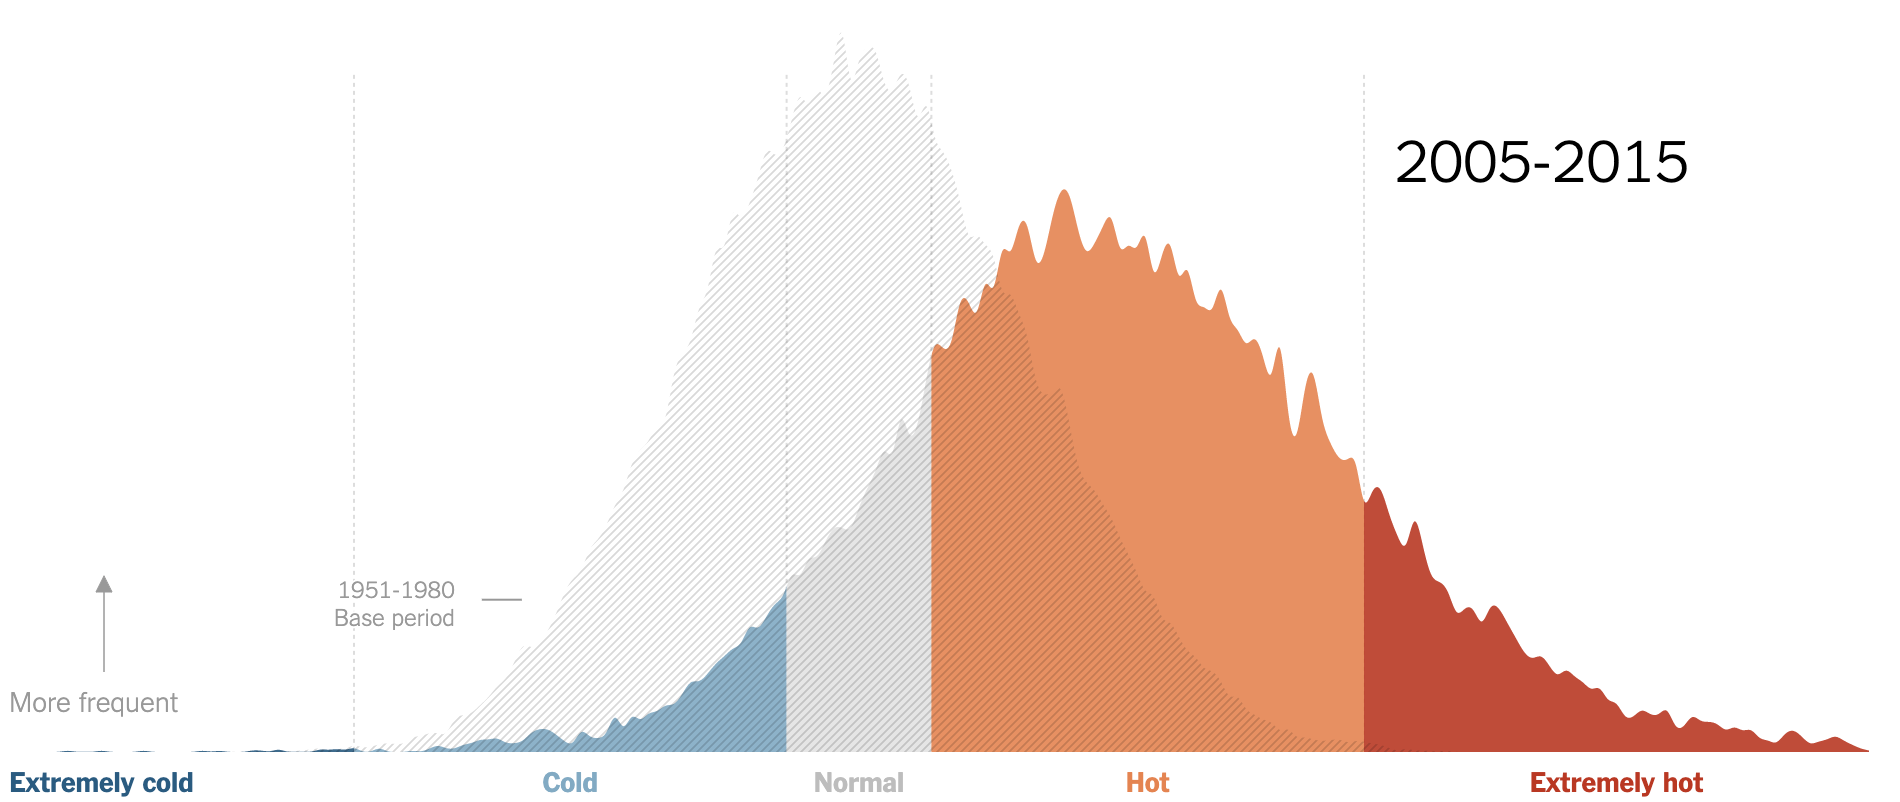
The two graphs below display the distribution of daily maximum temperatures during summer in the northern hemisphere for the periods 1951-1980 and 2005-2015. The graphs are from a newspaper article, so they contain generalisations for the temperatures (extremely cold to extremely hot on the horizontal axis) and the frequencies (increasing frequency on the vertical axis) rather than exact numbers.
Nonetheless, its clear that the temperature range that is considered normal (i.e. the area around the peak of each curve where the most common maximum daily temperatures occur) was hotter during 2005-2015 than it was in 1951-1980. (The display in the link also presents two intervening time periods that demonstrate the way the shape of the graph has progressively shifted over the 65 years covered.)
Equally striking, and perhaps more likely to be noticed by people living in the northern hemisphere, is the dramatic increase in the frequency of extremely hot days. Its difficult to be precise but the increase seems to be around 100-fold. That was 2005-2015. Global warming has increased even further in the last eight years. Indeed, the last seven have been the hottest on record.
And you ain’t seen nothing yet
Its not just humans that are suffering and it isnt going to get any better.