Environment: Cryptocurrency using as much electricity as Sub-Saharan Africa
March 9, 2024
Renewables are about to supply the annual increase in electricity usage globally but cryptocurrencys power demands are surging. Most industrial fishing vessels are untracked, including those around Australia. Climate change has already caused 4 million deaths.
Mapping industrial activity in the oceans
70% of Earths surface is ocean. More than a billion people rely on the ocean for their primary source of food many more as an occasional meal. 80% of internationally traded goods are carried over the oceans. Oceans provide 30% of the worlds oil. The oceans are increasingly important for mining, aquaculture and renewable energy. Threats to marine ecosystems grow yearly. And yet, compared with the land, we know comparatively little about the oceans and their ecosystems, including little about the types and magnitude of human activities in them.
The movement of ships can be tracked publicly using the automatic identification system (AIS) that they carry (although not all ships have to use it and some turn it off or manipulate the data at times). Movements can also be tracked with satellite imagery, which isnt publicly available.
Using these two databases, detailed maps have been produced of industrial shipping activities (roughly, vessels larger than 15 metres) and energy infrastructure in coastal waters, which account for about 15% of the global oceans. The results for 2017-2021 reveal that:
- At any moment, about 63,000 vessels are on the water, almost half of which are fishing vessels.
- 70% of fishing activity occurs around Asia. 70% of these vessels are Chinese.
- Only a quarter of the worlds industrial fishing is publicly tracked. Almost all the Asian coast is a hotspot for untracked activity, but its far from alone.
- Europe has the highest percentage of publicly tracked fishing vessels (61%) but the next highest continent is Australia with just 25%, little better than Asia and Africa at 22%. North America performs worst at 17% publicly tracked.
- 65% of non-fishing shipping activity, mostly involving transport and energy vessels, occurs around Asia. A more respectable 70-80% of this activity is recorded in the public tracking system.
- When covid started, fishing activity dropped by 12% but non-fishing activity was unchanged.
- By the end of 2021, there were about 28,000 energy structures in offshore waters worldwide. Offshore wind turbines are burgeoning and now outnumber oil structures.
- Most oil infrastructure is concentrated in 13 zones, with the USA (2,200 sites), Saudi Arabia (770) and Indonesia (670) dominating.
- Offshore wind development is concentrated off northern Europe (52%) and China (45%).
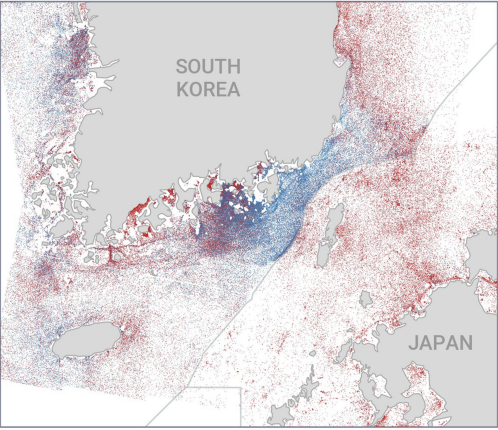
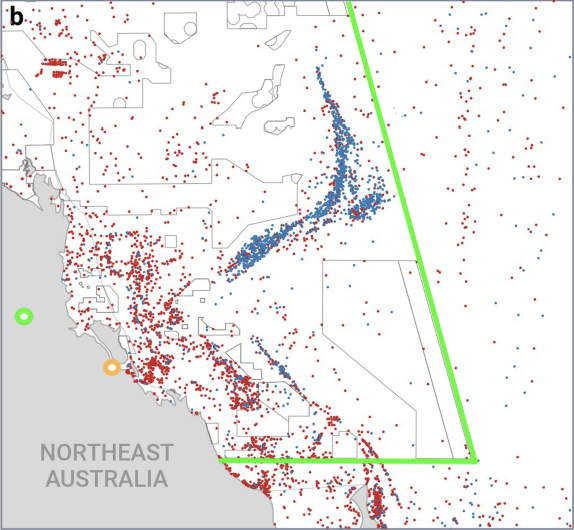
The following two maps illustrate the findings. Each dot represents a detected fishing vessel during 2017-2021. The publicly tracked ones (recorded in the AIS) are shown in blue and not publicly tracked ones (seen in satellite images but not recorded in the AIS) in red.
The area between South Korea and Japan recorded 1,975,000 vessels, of which 69% were not publicly tracked.
And to wipe the smiles off any smug Australian faces, the map of north-eastern Australia shows high levels of not publicly tracked vessel activity at the southern end of the Great Barrier Reef Marine Park (marine boundaries marked with the green line). To orient you, the green circle is Rockhampton and the orange one is Gladstone.
Renewables to meet growth in electricity use
Global electricity demand is growing by 2-3% per year and electricity now provides about 20% of all energy consumed (but electrification needs to proceed even faster still). About 85% of the additional demand is occurring outside the advanced economies, largely in Asia.
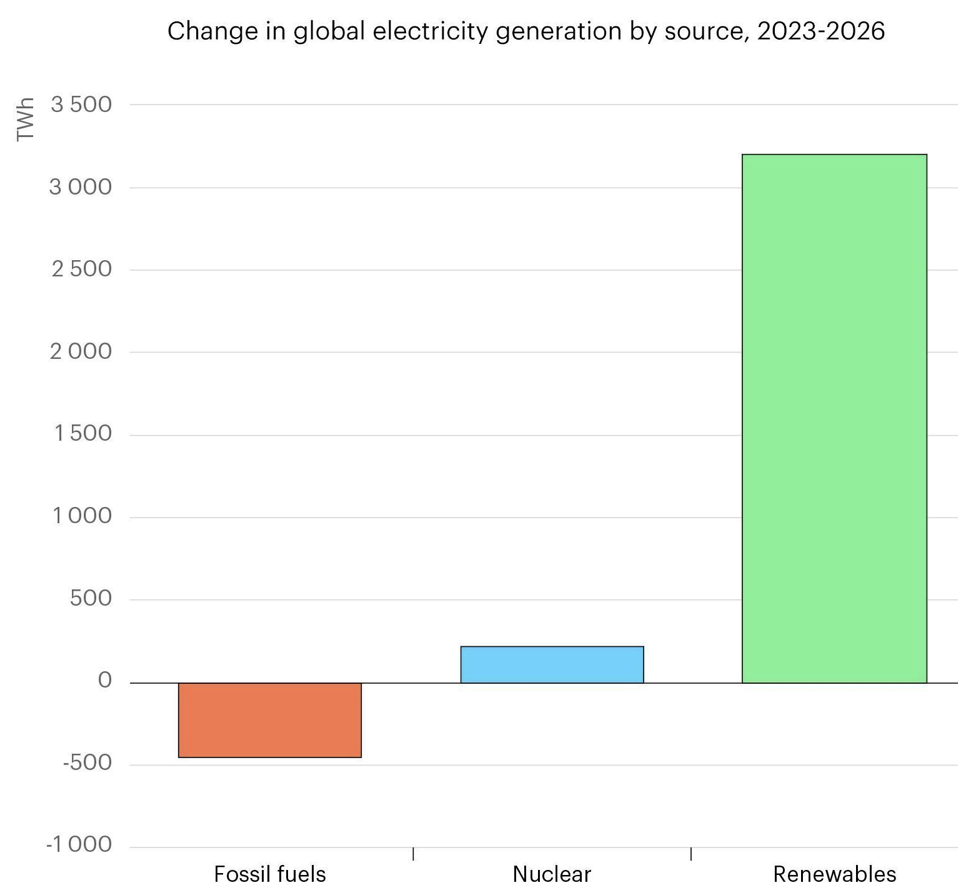
Between 2023 and 2026, the share of electricity generated by renewables (solar, wind and hydro) is forecast to increase from 30% to 37%. Most of the increase will be provided by wind and solar, which together are now producing almost as much as hydro.
The main news from a climate perspective is that over the next three years additional generation by renewables (plus, joy of joys, a bit more nuclear) is expected to meet all the increased demand for electricity.
The dark continent
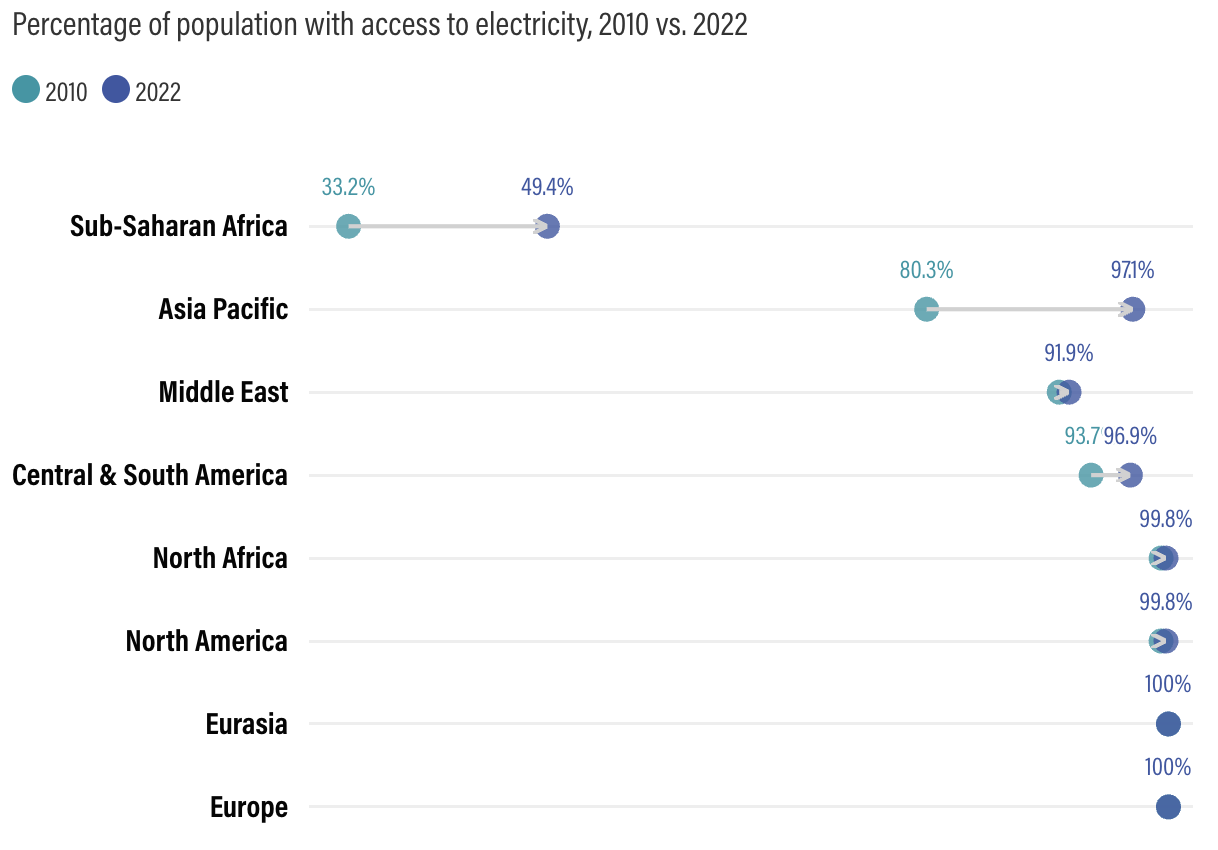
Broken record alert: per capita consumption of electricity has been increasing rapidly in Asia. However, it has not increased in Africa over the last thirty years despite half of the population now having access to electricity. Apart from the 50% who still dont have any access, the problem for many of those who do is cost.
To give you an idea of how powerless the over one billion inhabitants of Sub-Saharan Africa are, excluding South Africa, the average persons annual use of electricity is enough to power three light bulbs for a month. Still, there are on average 7 people in each household, often just one room, so thats enough electricity for about two light bulbs for a whole year. Luxury! More seriously, its something like a fiftieth of Australias average per person consumption of electricity. Two hundred years on and tropical Africa is still the Dark Continent.
Cryptocurrency mining damages the environment and health
I know next-to-nothing about cryptocurrency and how it is mined (I didnt even know it was mined) but apparently mining involves lots of computers working very fast. Computers are powered by electricity and most of the worlds electricity is produced by fossil fuels. So, with that Pulitzer Prize-winning piece of investigative journalism in mind:
- The computers behind cryptocurrency mining consume about 1% of the worlds electricity, about the same as that used in Australia. Add in data centres and artificial intelligence and it is about 2.5 times Australias usage.
- In the USA, cryptocurrency mining consumes up to 2.3% of the nations electricity and is responsible for emitting up to 50 million tons of CO2 every year. Electricity generation at five US power plants that supply large crypto-mining facilities quadrupled between 2020 and 2022.
- The computers run round the clock and need cooling with massive fans. The noise produced by crypto-mining facilities is claimed to be causing health problems for local residents and depressing property values.
Maybe we need to move on from Stop Adani to Stop Crypto. At least coal powered the Industrial Revolution. Im not sure what social benefits accrue from cryptocurrency. Come to think of it, the power currently used by crypto-mining must be about the same as that used in Sub-Saharan Africa.
4 million deaths already
making climate change a health emergency right now.
More than half of the 4 million climate change-related deaths since 2000 have been due to malaria in Sub-Saharan Africa and malnutrition and diarrhoeal diseases in south Asia (probably mostly children). Other causes include heatwaves, bushfires, storms, droughts, floods, famines, conflict, suicide, infectious diseases and chronic diseases such as heart disease. Four million is probably a very conservative estimate of the cumulative global death toll.
Other than covid (approximately 7 million deaths to date), deaths from climate change exceed those from any other WHO-recognised public health emergency.
The scale of climate change-related deaths was first documented by an Australian, Tony McMichael, twenty years ago but few were taking notice. Consequently, many of the subsequent deaths have been caused by two policy failures by rich countries: failure to eliminate the use of fossil fuels and failure to make high quality health care, essential medicines, vaccines, sanitation, etc. available to those most vulnerable to the harmful health effects of climate change.
Regrettably, responding to the health consequences of climate change remains low on governments priorities. Governments globally have committed approximately $14 trillion to fighting covid and $30 billion to polio eradication but are currently directing only $220 million per year to reducing the health risks of climate change and making health services climate change-ready.
Its too late to do anything for the four million but not too late to prevent many of the future climate deaths. Governments need to respond with the sorts of nationally organised programs that they mobilised during the first year or two of covid and with similar urgency and scale.
Keep cup capitalism
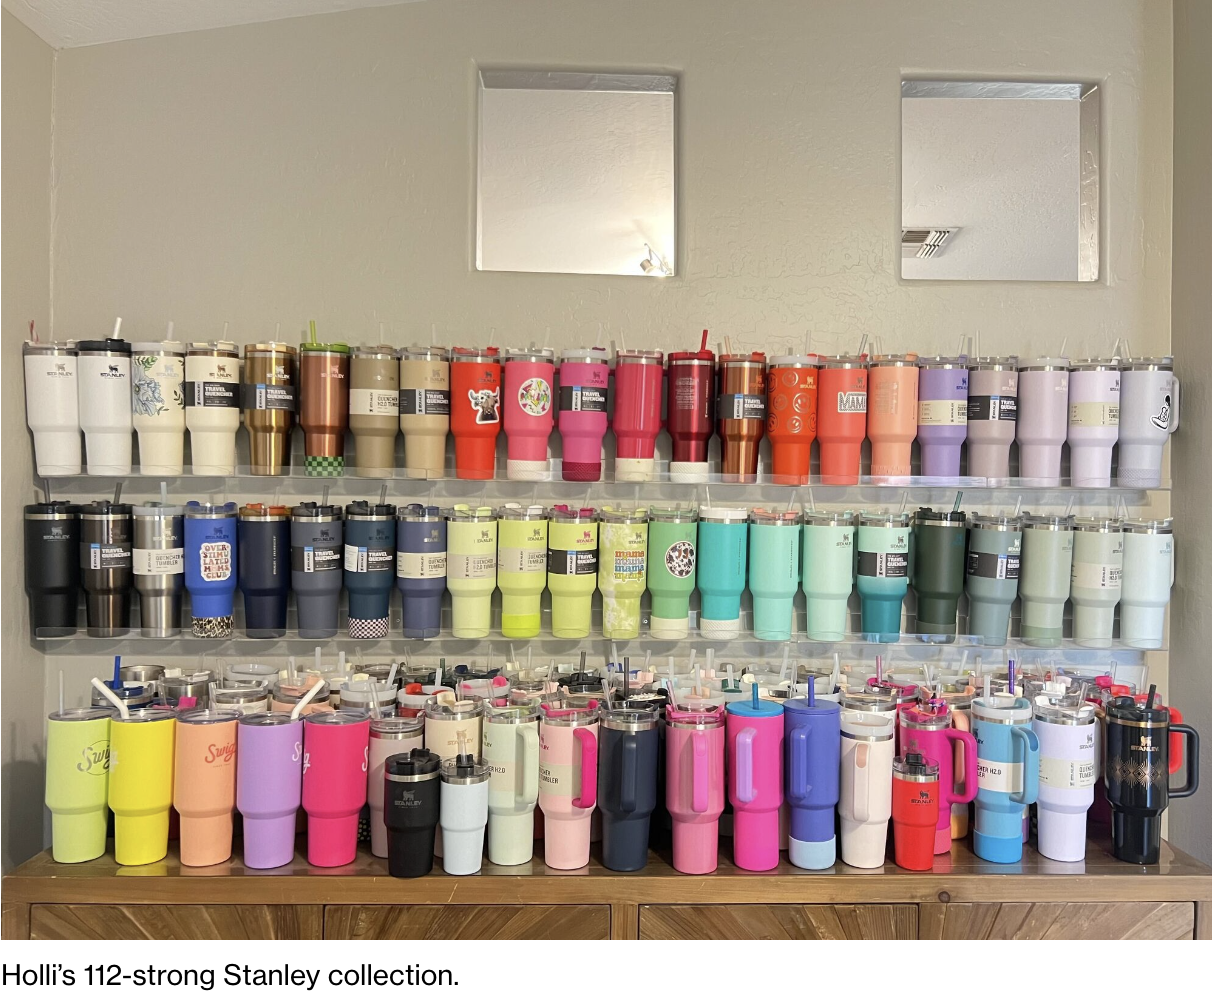
Do any of you have the slightest idea what a Stanley is? I didnt either - until about 5 minutes ago I was blissfully ignorant that it is anything other than a brand of sharp knife.
To lighten your darkness, the 1.3 litre Stanley is a reusable metal water bottle costing about US$45. But more than that, a Stanley is part utility, part status symbol and part internet craze: There are limited-colour drops, influencer testimonials and collaborations with major brands. When Stanley and Starbucks teamed up on a pink tumbler for Valentines Day, Target customers camped out to snag one, sometimes coming to blows. Those cups now sell for more than $300 on eBay.
Of course, being reusable is not the same as being reused, particularly not if you own a hundred of them.
Everything about this story horrified me: the waste, consumerism, influencers, corporate exploitation, crazy crazes, and especially the Tik and Tok videos please, shoot me now!
But, on reflection, maybe I need to buy my own Stanley and stuff my haughty disdain into it.