Environment: Do CO2 emissions influence your life expectancy?
June 10, 2023
Military activities generate uncounted but large amounts of greenhouse gas. Ocean temperatures hit all-time peak in April. Victoria to end logging of native forests. And, do your personal CO2 emissions influence your life expectancy?
__
Military greenhouse gas emissions
Under pressure from the USA, the Kyoto Protocol, negotiated in 1997, excluded military activities from nations mandatory reporting of annual greenhouse gas emissions. The consequence is that in 2023 we still have only a vague idea of emissions from military activities, both for individual countries and globally. The vast majority of countries dont even recognise their military emissions as an issue, let alone measure or report them.
Globally, military GHG emissions have been estimated to be somewhere around 1-5% of reported emissions, although it could be even higher if supply chains, equipment manufacturing and actual warfare were added. The 1-5% figure, however, is roughly on a par with international shipping and international aviation which we also know little about.
It goes without saying that the USAs military is the largest emitter, estimated at about 42 tonnes of CO2-equivalent per staff member per year considerably higher than the per capita emissions of any individual country. Jet fuel use is the major contributor: an F-35 fighter jet emits about the same amount of GHG per 160km flown (i.e. in 5 minutes) as an average petrol-driven car in one year.

As well as military activities exacerbating climate change, climate change presents a threat to military activities. The USA has 1700 bases on coastlines that could be vulnerable to sea level rise and an assessment of 79 of their bases indicated that half to two-thirds are at risk of recurrent flooding, droughts and wildfires.
In a Commentary in Nature, eight UK-based academics call for:
- Improved capacity for militaries to calculate, manage and reduce their emissions by, for instance, reducing spending on carbon-intensive programs and adopting low carbon technologies. The long period of service of much military hardware the F-36 will be in service for about 60 years presents a major problem here;
- The development of common standards for transparent and comprehensive accounting and reporting by nations of their military emissions and how much theyve been reduced, plus independent verification of these figures;
- Research into the impact of armed conflicts on the climate and society, including infrastructure damage, land-use changes, socio-economic shifts and post-war reconstruction.
Do your personal CO2 emissions influence your life expectancy?
Most definitely yes, according to the graph below (Australia is the circle just above the C of Canada).
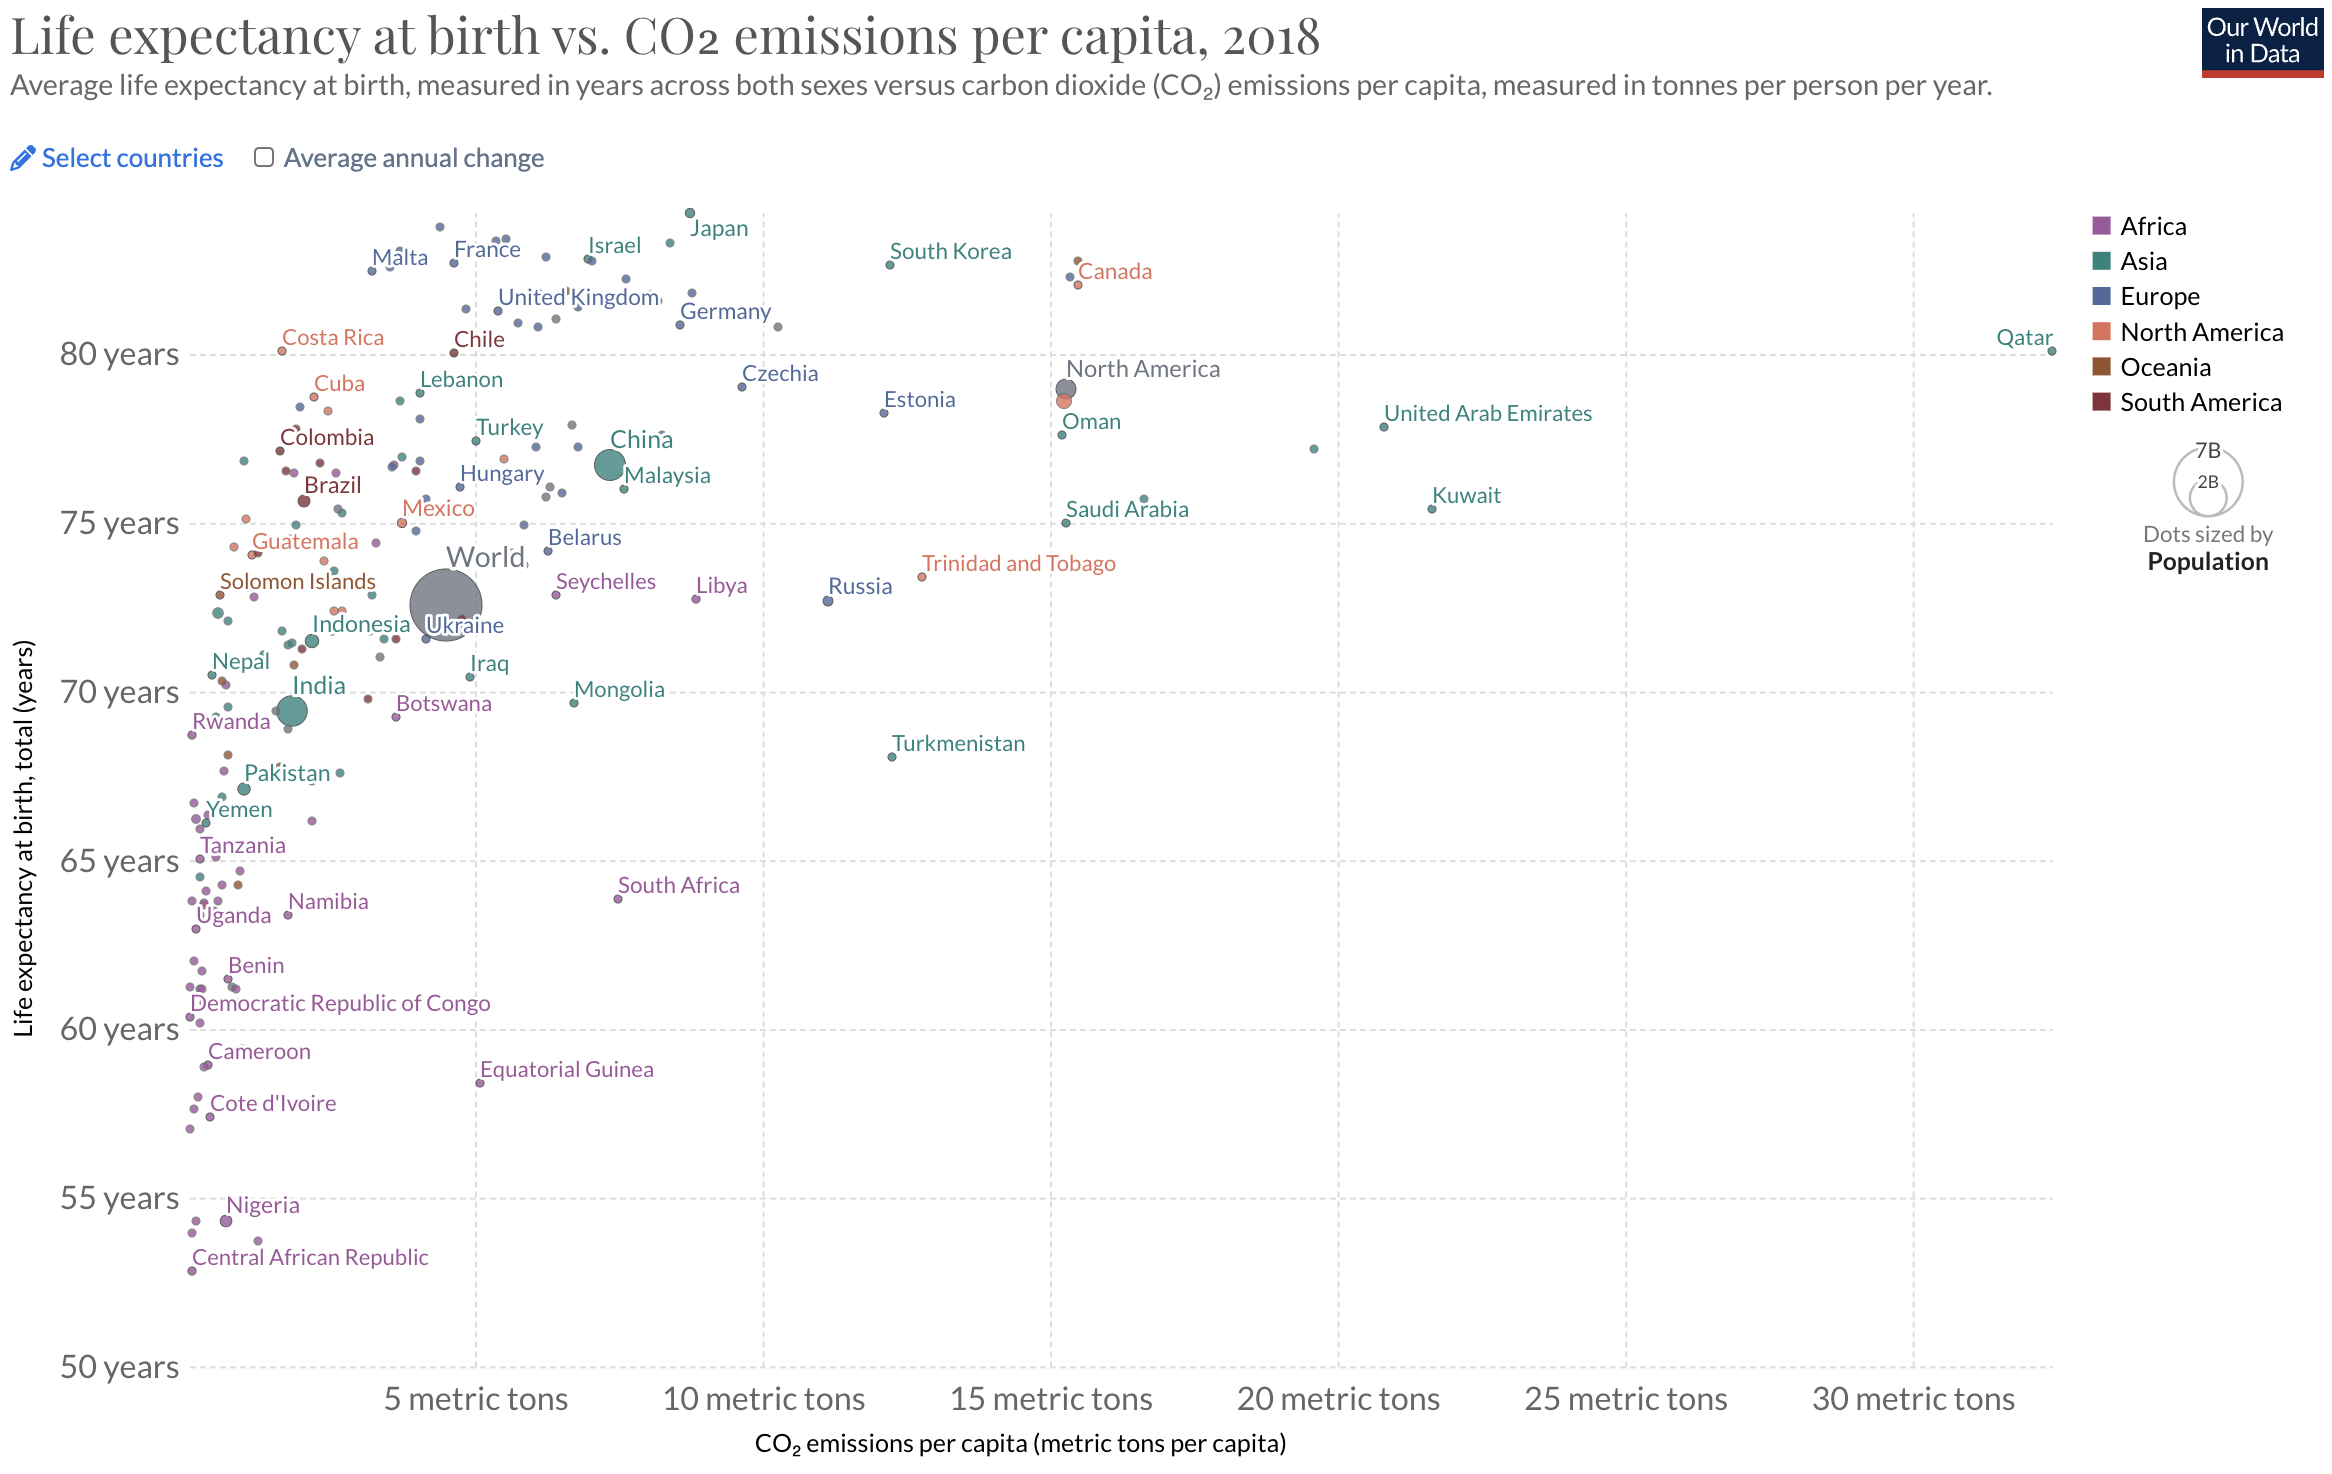
Now, Im being rather naughty with that attention grabbing claim one should definitely not extrapolate population-level data to the personal experience - but it is interesting that, up to about 4 tons per person per year, at the national level an increase in emissions per person is closely associated with increased average life expectancy at birth.
I am not suggesting that if you increase your personal CO2 emissions you will increase your life expectancy. Although, that said, there are no doubt some personal behaviours that have higher emissions that do contribute to better health and a longer life e.g. eating better, living in better, safer housing, better access to electricity, wearing more weather-appropriate clothing, wearing a crash helmet when riding a bicycle.
It seems from the graph that once national emissions exceed about 4 tons per person per year, country-specific factors become the dominant influence on the CO2-lifespan relationship. It is also clear that there is no gain in lifespan associated with national emissions exceeding 8-9 tons per person per year.
A slight concern arising from this graph is that 4 tons per person per year is a bit higher than the 3 or so tons per person per year that is broadly accepted as the level we need to get down to globally to bring warming under control. Provocatively, those of us who live in relatively rich, healthy countries may need to accept a slightly shorter life in order to be able to live at all.
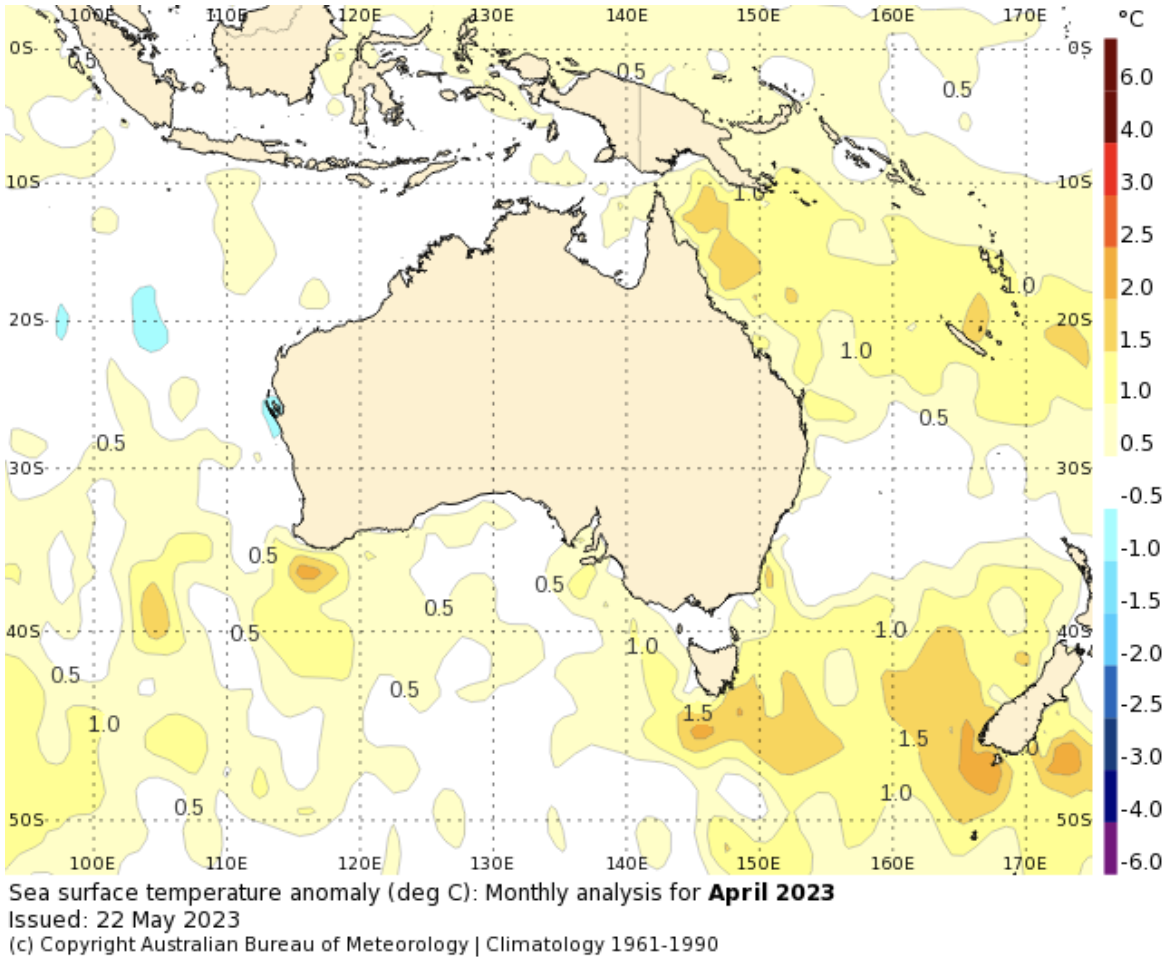
Rising sea surface temperatures
The figure that is most commonly cited as evidence of global warming is the average temperature change over the whole surface of Earth (currently +1.15oC compared with the average from 1850-1900). There is, however, considerable variation around the globe. For instance, cold places and times - the poles, mountain tops and winters - are warming more quickly than the rest and land is warming more than water.
That said, the worlds oceans have absorbed about 90% of the additional heat stored by Earth since 1750 and definitely are warming. In fact on April 1st the global average sea surface temperature set an all-time record of 21.1oC, which is over a degree hotter than the average for the very recent period of 1982-2011. When we move into the next El Nino, this record is likely to be shattered.
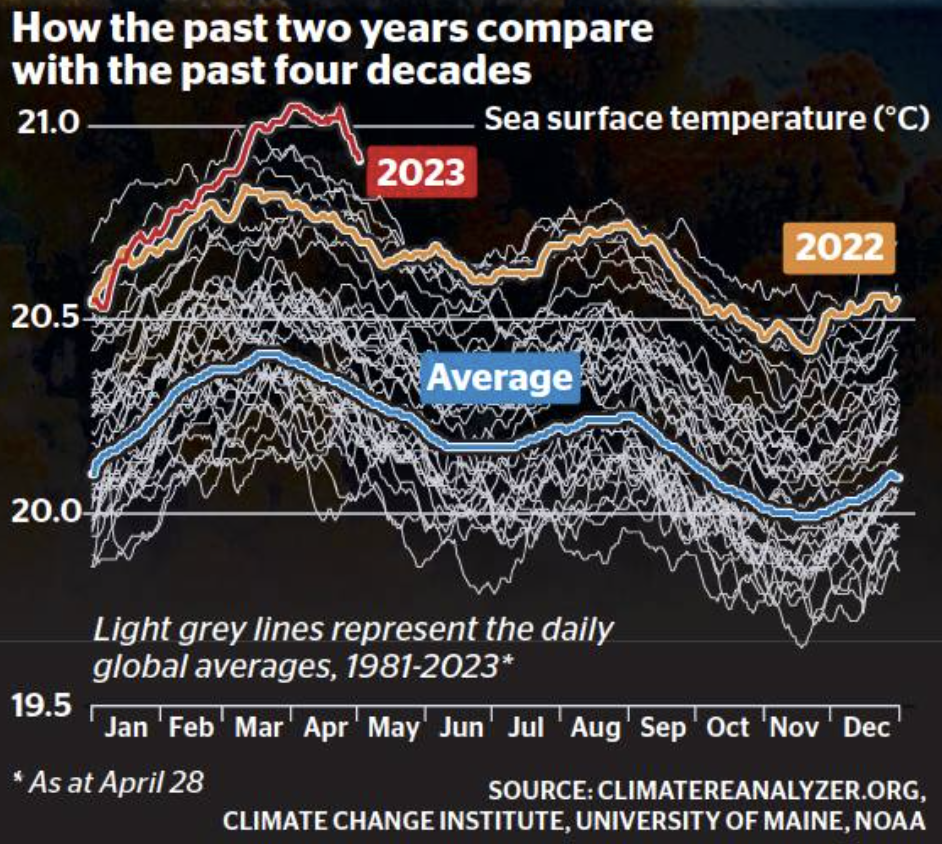
The figure below provides a very clear illustration of what is happening. The blue line displays the average daily sea surface temperature for each year between 1981 and 2023 (the light grey lines are the individual daily averages). The orange line displays the daily temperatures for 2022, which are throughout the year about 0.5oC higher than the average for the previous forty years. The red line for 2023 clearly shows that in March and April the sea surface temperature was about 0.7oC warmer than the previous four-decade average.
While lots of the waters around Australia in April 2023 were close to the average for 1960-1990 (map below), there were also vast areas that were 0.5-1.5oC above the average and only a few small areas around Shark Bay and further out in the Indian Ocean were below the average.
One rule for businesses, another rule for protesters
The Sydney Morning Herald reported this week that the Harbour Tunnel had been blocked, sparking traffic chaos, three times in the previous two days by trucks that exceeded the height limit. Such an event has happened in Sydneys road tunnels 57 times already his year.
The drivers and owners of the trucks have on each occasion not been charged by police, released on bail, sentenced by the magistrate to jail for 15 months and denied bail pending appeal.
Which offence should be punished more: blocking a highway and creating inconvenience for a noble cause or doing it negligently for corporate and personal profit? State governments around Australia have clearly signalled their priorities in their answers to that question.
End of native forest logging in Victoria
I imagine that most of you have heard that the Victorian government has committed to end the logging of native forests by the end of this year. This is great news but is it as good as it sounds?
Environmental Justice Australia has produced a short report that details the history leading up to this very welcome decision and what it will mean for Victorias forests, threatened wildlife, forestry industry and workers, and the availability of timber.
Just to put the decision into perspective, five-sixths of trees logged in Victoria already come from plantations and its plantations that provide employment for the vast majority of the states 15,000 timber industry workers.
WA has already announced the cessation of native tree logging by 2024 and the challenge now is for the governments of Queensland, NSW and Tasmania to follow suit with complete bans across their states. Whose pockets are the premiers in? Silly question see previous article.
Looking forward, Lindenmayer and Taylor have some very practical suggestions for restoration of the degraded forest areas and their fragmented ecosystems. To promote the survival of the many critically threatened animal and plant species, they suggest: nesting boxes to provide shelter until trees mature and form hollows; collection of vast quantities of native seeds to re-establish forests with the appropriate tree-mix where logging and fires have destroyed all local seeds; avoiding industrial scale thinning and prescribed burning; control of feral animals; robust monitoring programs; expansion of national parks; and involvement of and jobs for First Nations people.
The phoenix-like Night Parrot
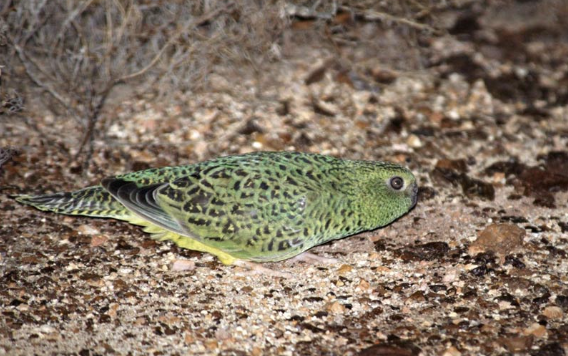
Despite occasional unconfirmed reported sightings, the Night Parrot was feared to be extinct for decades. Then in 2013, to great jubilation among birdos, a live Night Parrot was positively identified at Pullen Pullen in western Queensland. Since then more Night Parrots have been found at other locations, particularly in Western Australia where their range is wider and there seem to be more birds. Searches in country owned and managed by Indigenous groups have proven particularly rewarding.
Additional areas that seem suitable for Night Parrots but where none have yet been sighted have also been discovered and in May this year ecologists and six Indigenous ranger groups from across the country came together to share knowledge about the bird and ways to track and protect it. This three minute video includes interviews with some of the participants.
Night Parrots are ground dwelling (hence vulnerable to feral cats) and nocturnal, of course. They prefer spinifex habitat (see below), which is unfortunately susceptible to unmanaged bushfires.