Environment: Emissions rising and no green recovery visible
March 20, 2022
Despite endorsing the IPCC’s findings, and rising emissions, Morrison still supports coal development. New climate-social system model identifies central importance of responsive political institutions for controlling global warming.
Australia’s two faced climate action
On 27th February 2022, the Australian government endorsed the following statement in the new IPCC report on Climate Change Impacts, Adaptation and Vulnerability:
“The cumulative scientific evidence is unequivocal: Climate change is a threat to human well-being and planetary health. Any further delay in concerted global action on adaptation and mitigation will miss a brief and rapidly closing window of opportunity to secure a liveable and sustainable future for all.“7x2jFcyLXUNo9o!#biDBGnMQ
Barely two weeks later, Scott Morrison said that the Coalition wants Australia’s coal power stations to “run as long as they possibly can”, vowing to support the coal industry if re-elected. Yet again, he trotted out the ridiculous and ignorant ‘when the sun doesn’t shine and the wind doesn’t blow’ argument. As ever, it’s difficult to know whether he’s stupid or he thinks we are.
The IPCC report has been pretty well covered in the popular media channels over the last three weeks and lots of summaries are available on the web. However, if you haven’t caught up with what it says and want to be able to bluff your way through, I recommend the summary by the World Resources Institute and The Conversation article by three Australian vice-chairs of the panel that produced the report. You might also want to have a look at the IPCC’s fact sheets on Australasia and Small Islands (think Torres Strait, not only the Pacific Ocean).
My takeaway messages are that while it’s become commonplace over the last decade to say that 2 degrees of warming isn’t safe, the report documents that climate change is already having multiple severe impacts on all aspects of life and the environment, and that it is now clear that 1.5 degrees isn’t safe. Climate action strategies that plan for a temporary overshoot of 1.5 degrees between 2040 and 2100 increase the dangers to humanity and are likely to lead to irreversible changes in some ecosystems and some Earth systems.
To my mind, the whole climate change problem can be summarised in seven issues:
- Mitigation: reduce emissions to zero as rapidly as possible.
- Adaptation: be prepared for the current and future inevitable effects of climate change.
- Loss and Damage: help and compensate people who suffer harms that can’t be prevented or adequately prepared for.
- Social Justice: for those who suffer the most, particularly those who are least responsible for the problem.
- Responsibility: those who are most responsible for the problem and those with the most resources (often the same) must provide the vast majority of the financial, technical and intellectual resources needed.
- Urgency: the time for dramatic action on all of the above is right now.
- Stop Making Things Worse: pretty much speaks for itself.
Green recovery. What green recovery?
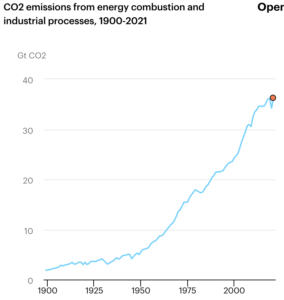
During its first year, the Covid epidemic caused global CO2 emissions from energy and industry to fall from 36.1 gigatonnes (Gt) in 2018 and 2019 to 34.2 Gt in 2020. But 2021 saw emissions soar to their highest level ever, 36.3 Gt. The largest ever annual decrease in the actual tonnage of CO2 emissions in 2020 was followed by the largest ever annual increase in 2021. Coal accounted for 40 per cent of the CO2 emissions growth in 2021 and global coal emissions are now at an all-time high.
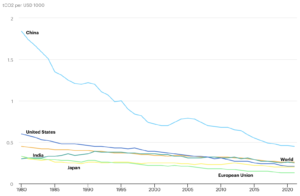
Nationally, the percentage increases in CO2 emissions in 2021 were mostly in the 1-10 per cent range, with Europe and the USA registering 7 per cent and China 5 per cent. In terms of absolute numbers, China dominated the field, of course, and their per capita emissions are now marginally above the average of the advanced economies (over 8 tonnes per person per year). China has, however, made a dramatic reduction in its CO2 emissions intensity – the amount of CO2 emitted per dollar of GDP. In 1980, China’s emissions intensity was 1.8 tonnes of CO2 per US$1000 of GDP but by 2021 this had fallen to 0.45 tonnes (still double that of the USA).
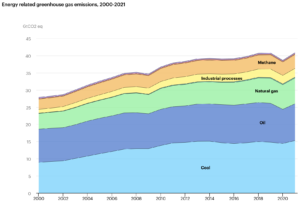
Globally, total greenhouse gas emissions from energy and industry also reached a new peak in 2021, 40.8GtCO2eq – marginally higher than the previous peak in 2019. Almost 90 per cent of total greenhouse gas emissions from energy and industry is CO2.
The bottom line is that the world has most certainly not heeded the many calls for a sustainable, green recovery from Covid.
Linking climate science and social science
The climate and energy models used to link future levels of greenhouse gas emissions to concentrations of greenhouse gases in the atmosphere and the likely global warming have become increasingly complex, sophisticated and reliable. Missing from these models, however, are individual and social factors such as personal perceptions of climate change, beliefs about the efficacy and cost of climate action, human behaviour change, public opinion, the influence of social networks and policy changes. The links between these factors and the level of global warming we can expect in 2100 are complex but not unknowable, according to a recent study that has developed a climate-social system model that includes consideration of these factors at individual, social, national and global levels (see figure below).
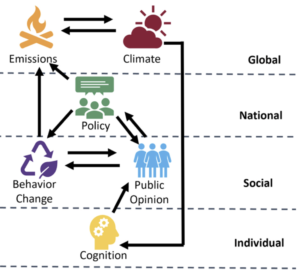
Also included in the model are eight feedback processes. For example, personal exposure to more extreme weather events, as a result of inadequate national and international climate policy creating higher emissions and more global warming, may lead individuals to be more receptive to the scientific evidence and start advocating for stronger policies. Such feedback mechanisms can lead to tipping points in personal behaviours and social policies similar to the predicted tipping points in Earth systems as the world gets hotter. The authors cite as an example the rapid take up of electric vehicles in Norway.
Having built their model, the authors ran it 100,000 times with different policy and emissions trajectories. Nearly 50 per cent of the runs produced warming in 2100 of 2.3 degrees Centigrade, which suggested to the authors that the world is moving away from the previous business-as-usual policies which predicted 4-5 degrees of warming. Only 28 per cent of the simulations produced global warming under 2 degrees C, which the authors misleadingly label “a substantial probability of meeting the 2C Paris Agreement target”. Misleading in two ways: I wouldn’t call 28 per cent a substantial probability, and the Paris Agreement is to keep warming “well below 2 degrees Celsius”, not simply “below” 2 degrees.
The model predicts that the most important factors that determine future emissions pathways and the ultimate level of warming are public perceptions of climate change and their experiences of the weather, the future costs and effectiveness of mitigation technologies, and the responsiveness of political institutions (in which case we’re well and truly … , you know what). The authors recognise that this study will be far from the last word in this line of research but it seems to me that they’ve made a useful contribution.
World’s croplands increase
In 2019 the world’s croplands covered approximately 1,240 million hectares (MHa), an increase of 9 per cent since 2003. Half of the new cropland replaced natural vegetation and tree cover – not good for the protection of ecosystems. Despite this increase, because the world’s population grew the global per capita cropland area decreased by 10 per cent. On the other hand, because of intensified agriculture the productivity of the cropland per capita increased by 3.5 per cent – i.e. in the early 21st century, agricultural productivity grew faster than the population. Whether this is sustainable is another matter.
The amount of land devoted to growing crops has expanded by 125 MHa over the last twenty years (about the size of South Australia) and it’s expanded at a higher yearly rate in the last decade, as demonstrated in the table below. The biggest increase and the most rapid acceleration has been seen in Africa (total increase of 47 MHa). Despite a slowing rate, South America has also seen its cropland expand by 34 MHa since 2003.
Annual cropland area change 2004-2019
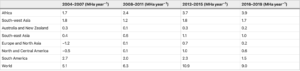
At the national level, Brazil is the standout, having the world’s largest net cropland increase over the whole period (23 MHa). India took second place (15 MHa). Australia and New Zealand are slow but steady contributors to the increasing cropland. Russia had the largest net reduction in cropland (almost 6 MHa). Interestingly, the country with the most cropland is the USA (just under 150 MHa throughout the period), followed by India (120 increasing to140 MHa) and China (around 120 MHa).
Small loss indicative of big changes
The loss due to climate change of a small, stone hut built a hundred years ago for the benefit a privileged few, sitting almost 3,000 metres above sea level in the Canadian Rockies, is not going to cause anyone in sub-Saharan Africa, the Pacific Islands, south-east Asia or the Torres Strait to lose any sleep. Nonetheless, it is a potent reminder that the effects of climate change are ubiquitous and relentless, and that Covid is interacting with global warming in many unexpected ways.