Environment: Industrial activities produce a third of emissions
October 28, 2023
Industrial emissions, many hard-to-abate, are increasing. Norway leads the roll-out of EVs but China dominates the number purchased and the production of steel and EV batteries. 40% of amphibians are threatened with extinction.
Industrys rising GHG emissions
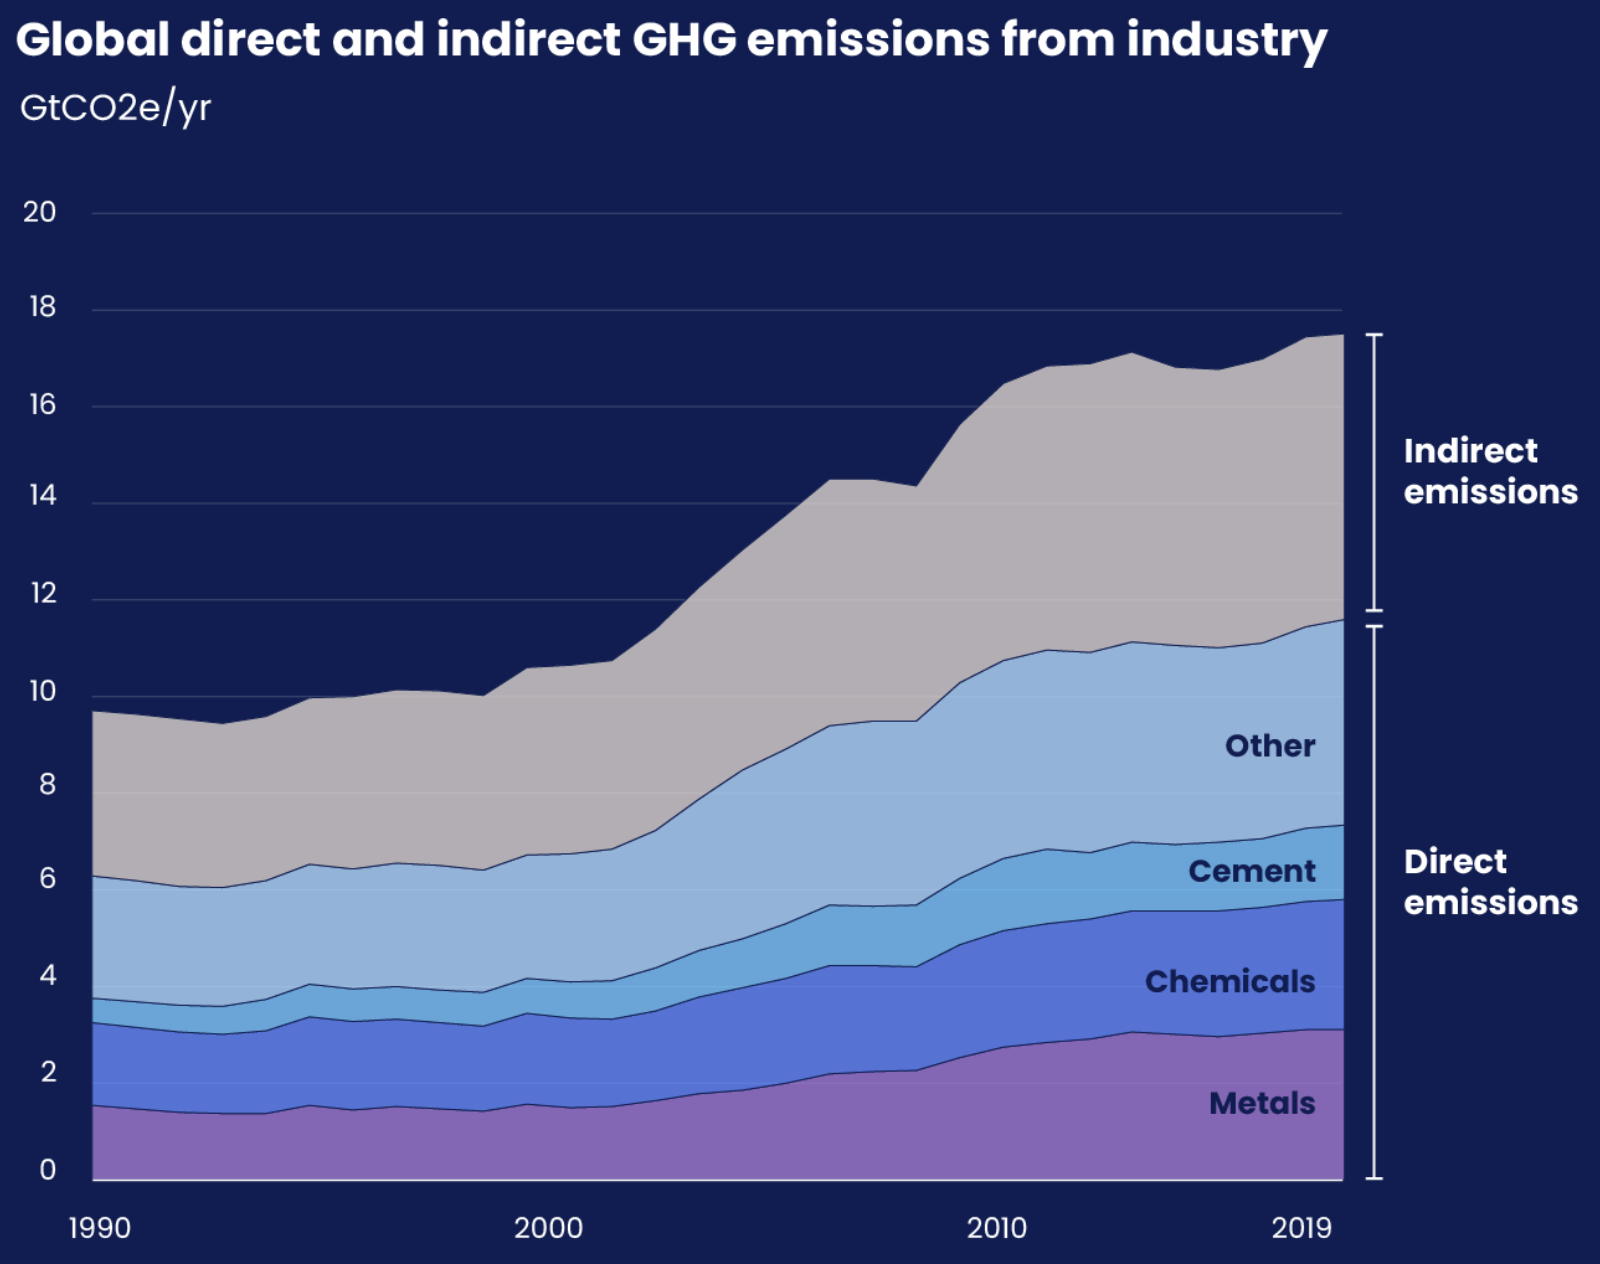
Industrial activities for example mining, manufacturing, construction and waste processing but not including the energy sector - account for a fifth of greenhouse gas (GHG) emissions globally. Add in the sectors indirect emissions - those released during the production of the energy that the sector uses - and it reaches a third (according to the GHG accounting rules, these emissions are counted in the energy sector, not the industrial sector). Since 2000, emissions from the industrial sector have been rising more quickly than those from transport, buildings, agriculture and power generation.
About two-thirds of industrys emissions, say 20% of total global emissions, come from producing iron and steel, cement and concrete, and chemicals, all ubiquitous products, all hard-to-abate industries. The use of both cement and steel has been growing at 2.5-3% per year in recent times.
Industrial activities directly and indirectly burn large amounts of fossil fuels but emissions also arise from the chemical reactions involved in the production processes. The latter emissions cannot be reduced simply by switching to renewable energy. The situation is made more difficult by the long life of most industrial plants. Nonetheless, reducing industrys emissions is critical to controlling climate change. Five changes are critical for this hard-but-not-impossible-to-abate sector:
- Reduce demand for cement and steel, which account for 15% of global CO2 emissions. For instance, plan and build compact cities, strict building codes, more efficient design and construction, substitution with alternative sustainable materials, reuse and recycle materials.
- Improve industrial energy efficiency. It has been improving but the rate needs to quadruple through, for instance, retrofitting plants with newer technology, building steel plants that operate with decarbonised processes, introducing and monitoring energy performance standards and reducing fossil fuel subsidies.
- Electrify industry. Industry uses energy to power machinery and produce heat. Most of the electrification so far has tackled the former but it is the latter that consumes most of the energy. There is considerable scope to increase the electrification of lower levels of heating with existing technologies (carbon pricing and removal of subsidies would encourage their roll out) but processes that require heat above 1,000oC, which produce about a third of industrys emissions, require much more research.
- Commercialise techniques for reducing CO2 emissions from the chemical reactions occurring during production. For instance, green hydrogen-based steelmaking, alternative binders for cement, green ammonia fertilisers, carbon capture and storage (this may be the only appropriate and viable use of CCS). This is not going to be easy and will need immense investment and government encouragement with sticks and carrots.
- Reduce methane emissions from oil and gas operations. For the remainder of its limited lifetime, the oil and gas industry must dramatically reduce the methane released during exploration, production, storage and transportation. Eliminating flaring and leaks is essential and can be done cheaply.
What these data and recommendations emphasise, yet again, is that while we may not have all the answers to controlling GHG emissions, we have enough knowledge, technology and economic know-how right now to make dramatic emissions reductions. Its not ignorance or impecuniosity that is holding us back, it is vested interests and stupidity.
In Australia, a major part of the problem according to Tony Wood of the Grattan Institute is the absence of a national climate plan. The plan needs the right mix of political commitment, credible policies, coordination with industry, and support from communities, plus a Net Zero National Cabinet Committee to implement the plan rather than let its targets and policies sit on the website gathering virtual dust.
Steel production in China and India
The use of steel is ubiquitous but not its production. China produces more than half of the worlds steel.
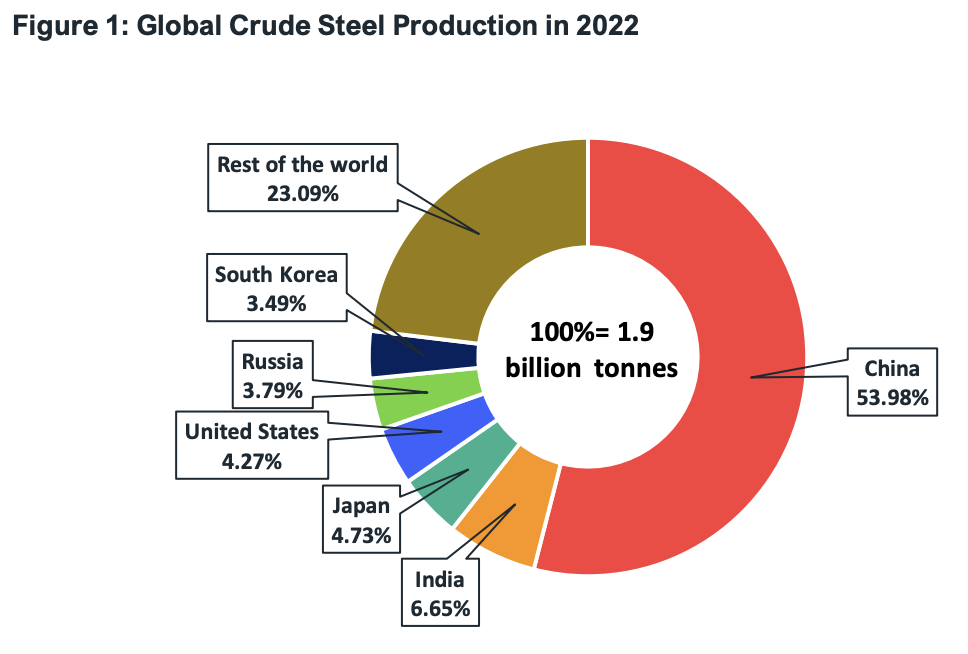
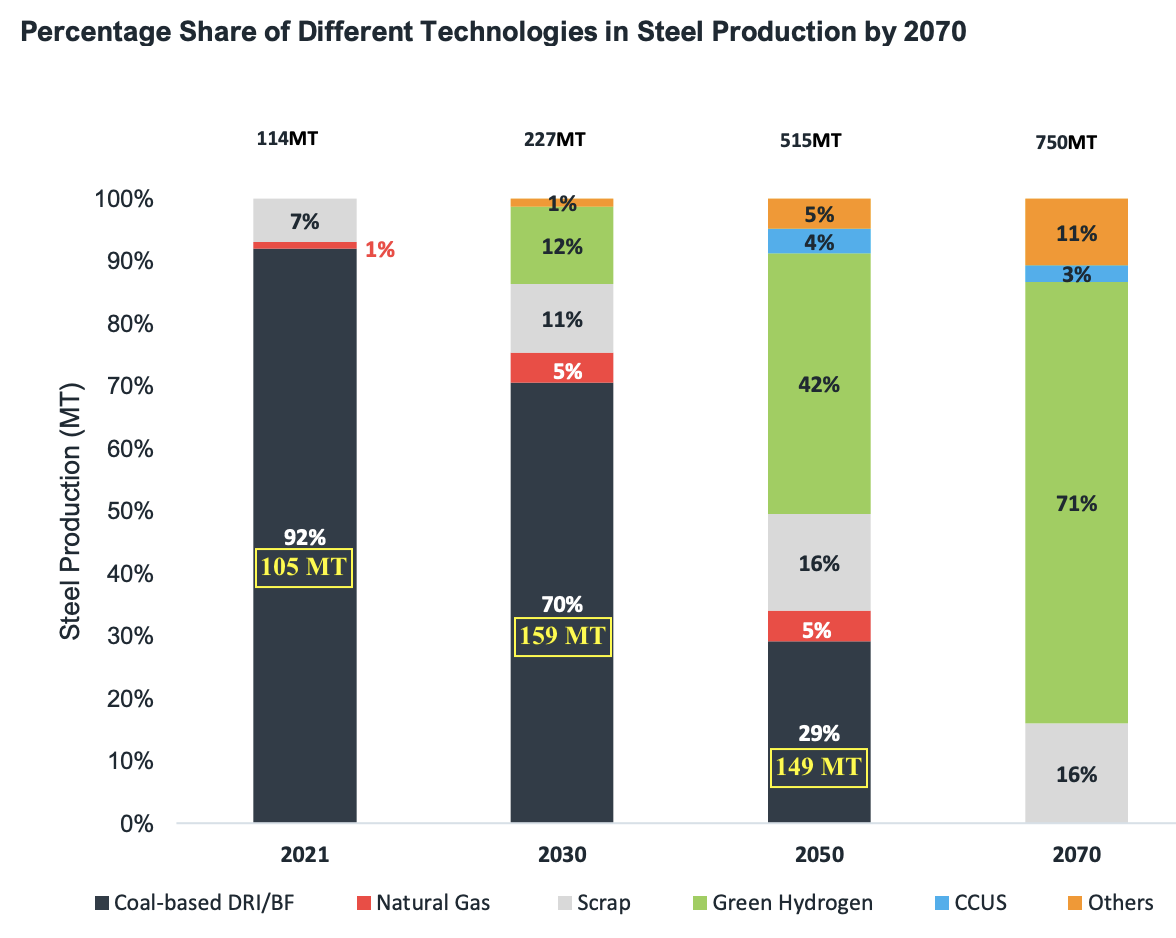
India comes second and has plans to expand its production greatly. But India is also conscious of the GHG emissions associated with steel production and is aiming to decarbonise the industry during its seven-fold expansion over the next 50 years.
Currently, 90% of Indias steel production is coal-based and this is projected to fall to 29% in 2050 and zero in 2070. Sounds good except that the actual amount of steel produced using coal is going to increase between now and 2050 (the yellow figures Ive added to the histogram below). And, inevitably, so will the greenhouse gas emissions.
Norway is close to EV saturation
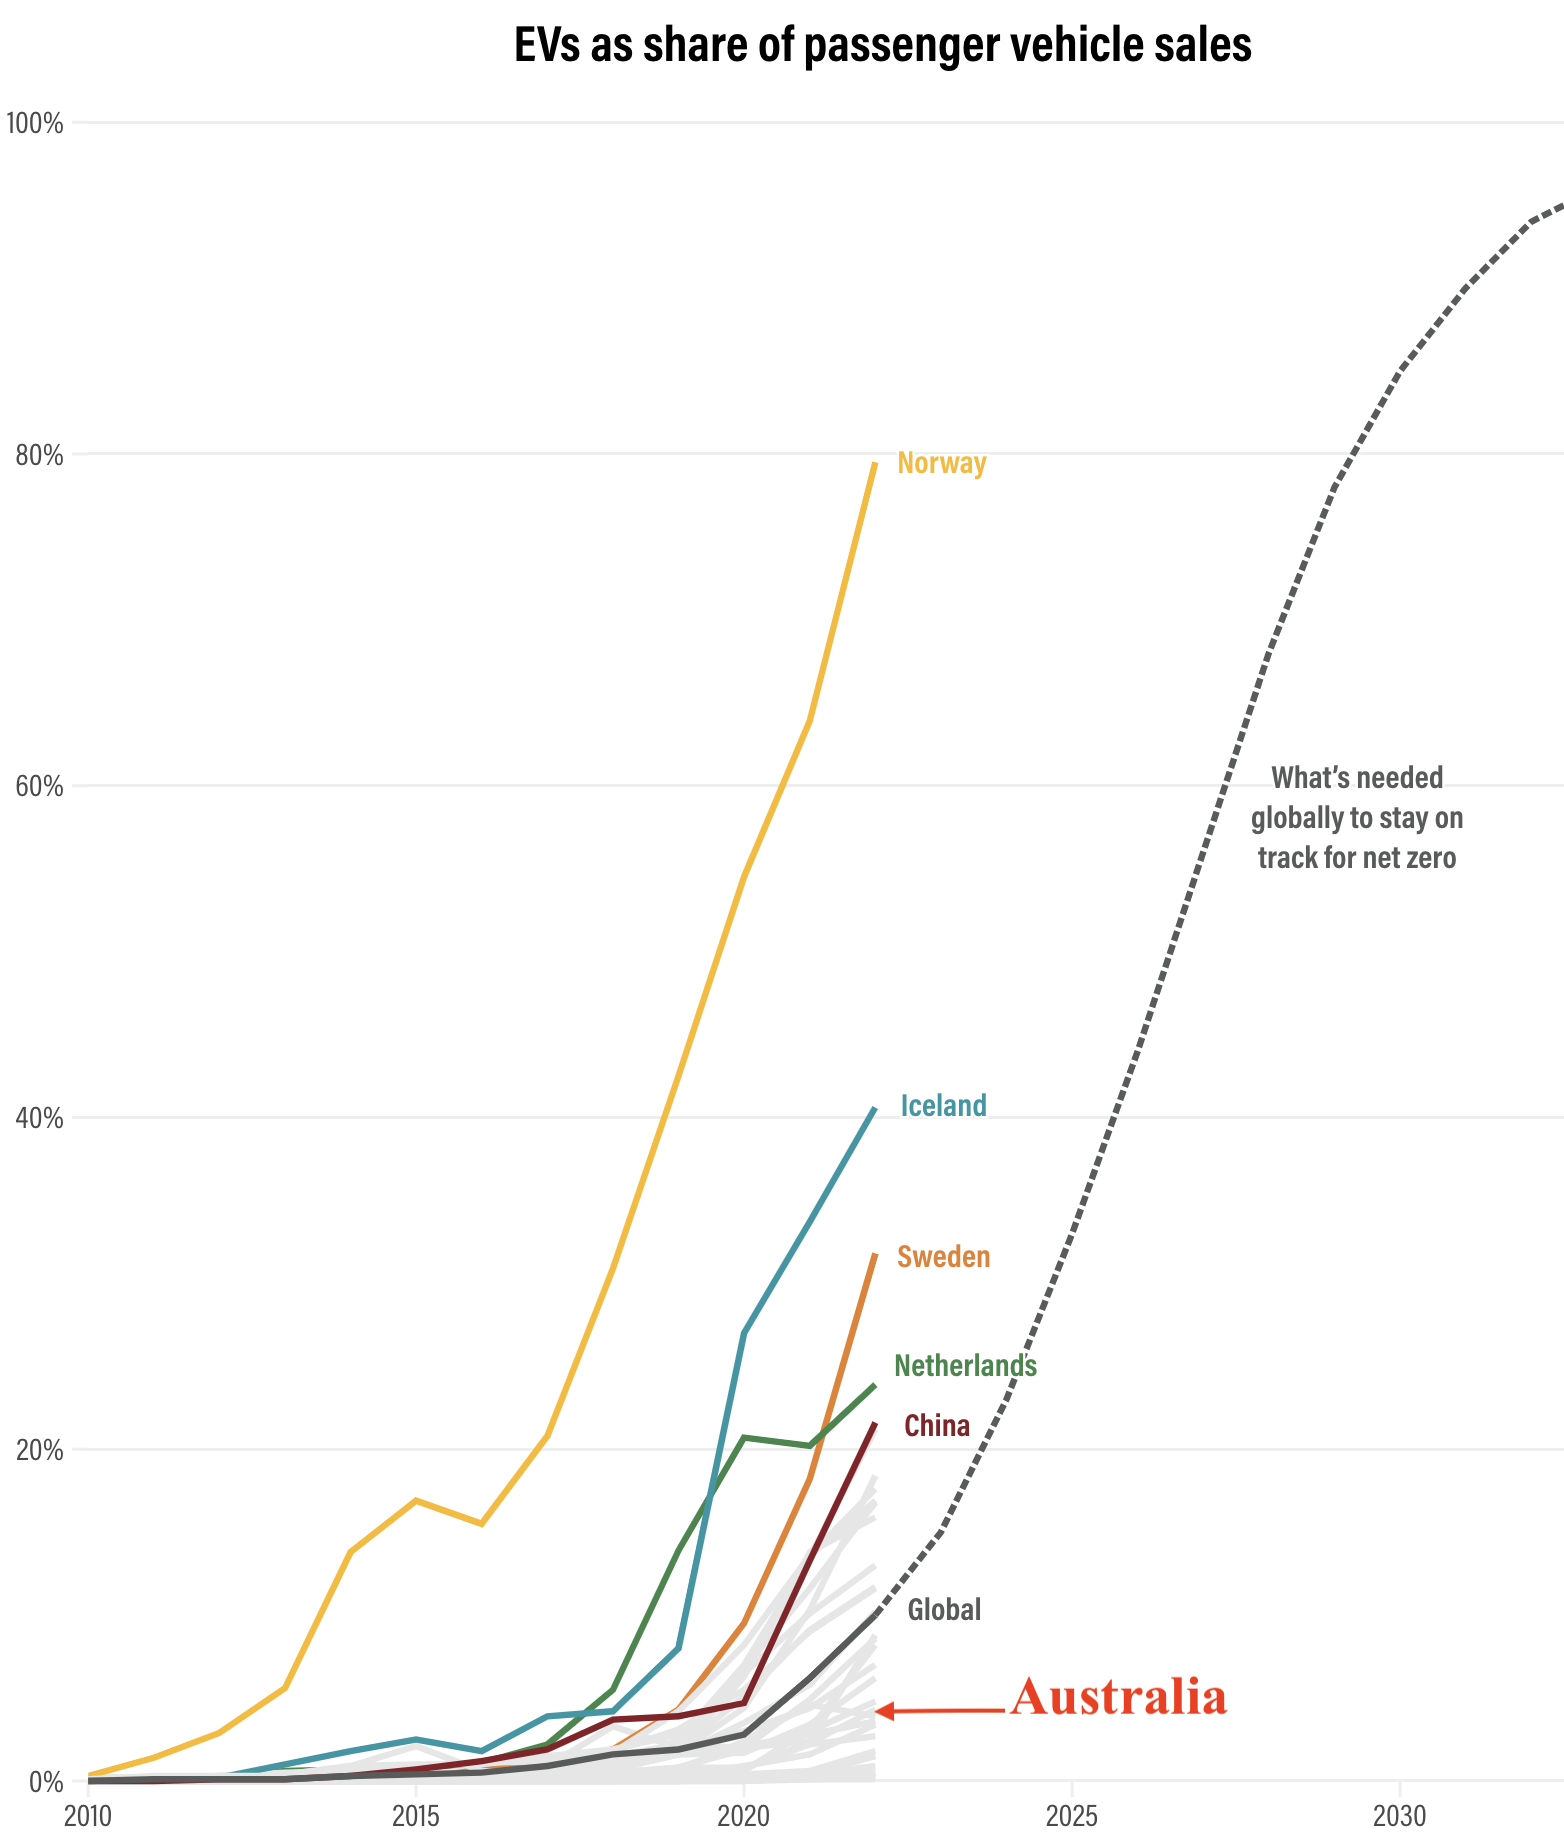
In 2022, 10% of global passenger vehicles sales were EVs (i.e., all-electric, not hybrid). In Norway it was an admirable 80%. Other than China (5% in 2020 and 22% in 2022), the only large car market to be above the global average is the EU (12%). USA (6.2%) is just over half way there, while Japan and India are both below 2%. Australias rate in 2022 was 4.3%. To keep global warming under 1.5oC, EVs will need to constitute 75-95% of passenger vehicles globally in 2030. This will necessitate an annual growth rate of 30%.
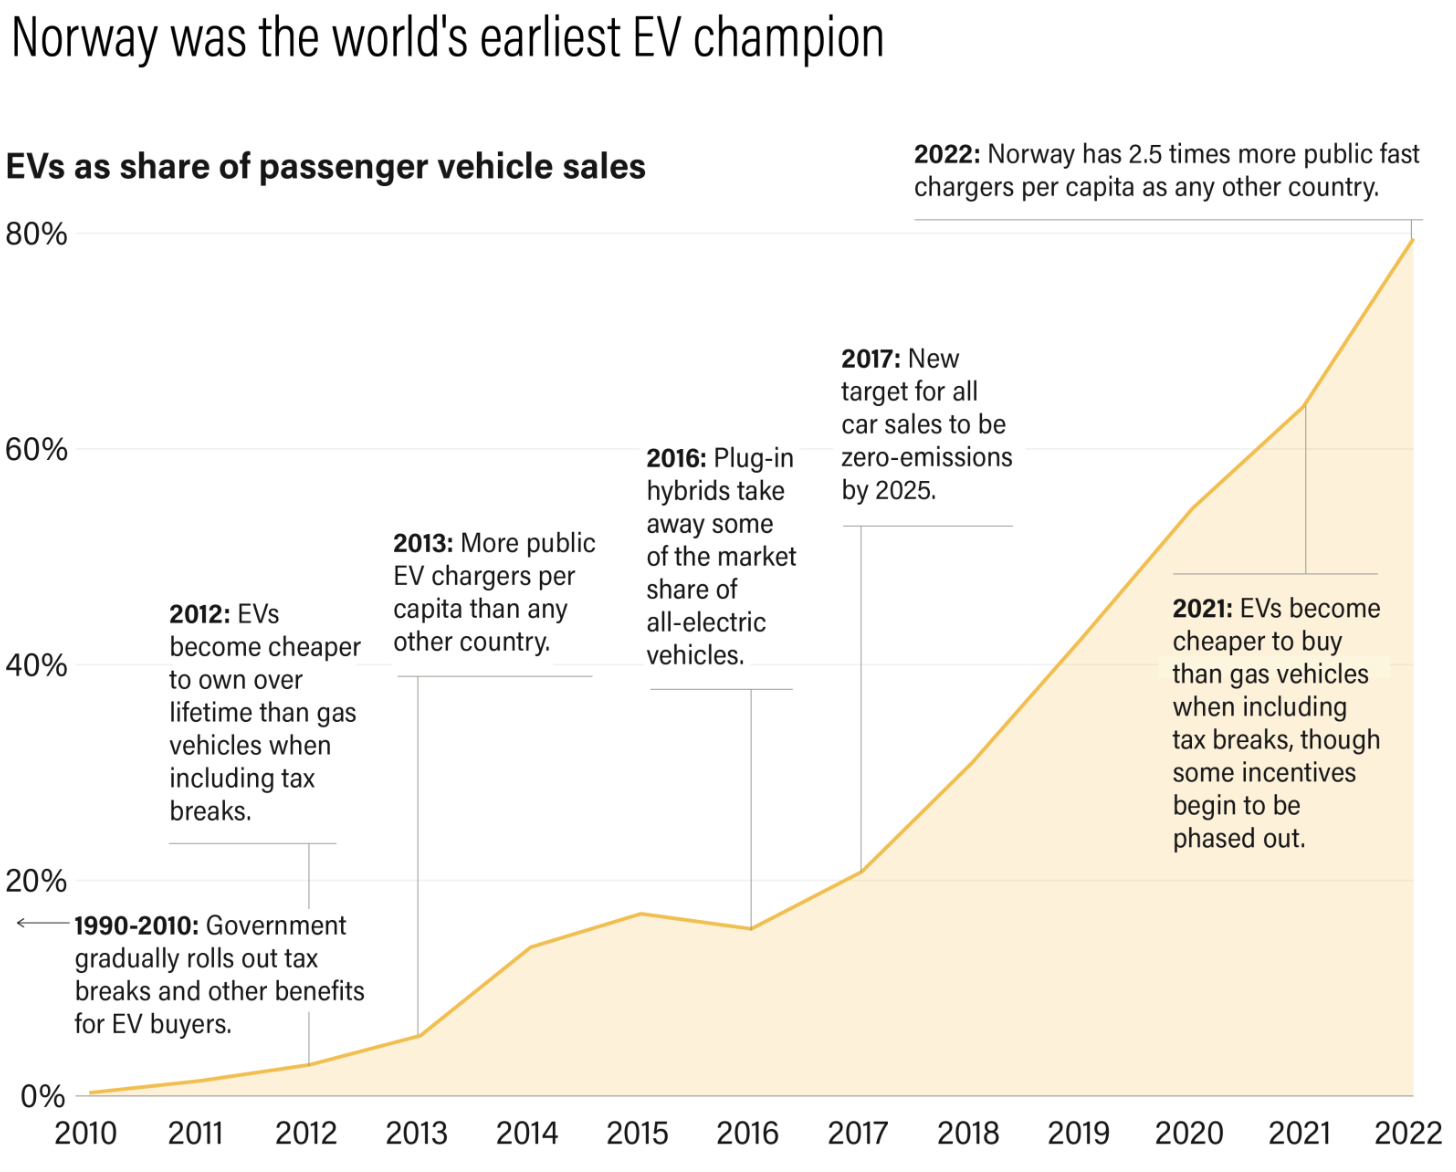
Falling costs and improving technology are obvious factors in the increasing popularity of EVs but it is government policies (incentives and infrastructure) that explain the successes of the high growth rate countries. The graph below identifies some of Norways actions.
The good news for all countries is that there is a tipping point. Once EV sales reach 1% of total sales, the growth in sales over the next five years escalates. For instance, four years after reaching 1%, Finland, Germany and UK all reached 17-18%. Two years after hitting 1%, Australia is already at 4.3%, which is where Finland was at the same point.
EV sales and batteries
Data doesnt always speak for itself. One problem is that the terms used in graphs and tables are not always clearly explained. Another is that it isnt always easy to understand how (if at all) information from different sources fits together.
The EV piece above focused on passenger vehicles, which I interpret to mean private passenger vehicles and Im fairly confident it meant vehicles that we would refer to broadly as cars, SUVs and the like.
The next diagram, from a different source, looks at EV sales globally in 2022 by different sorts of vehicles. Half of the EV sales were 2 and 3 wheelers, a little over a third were buses and only a seventh were passenger cars.
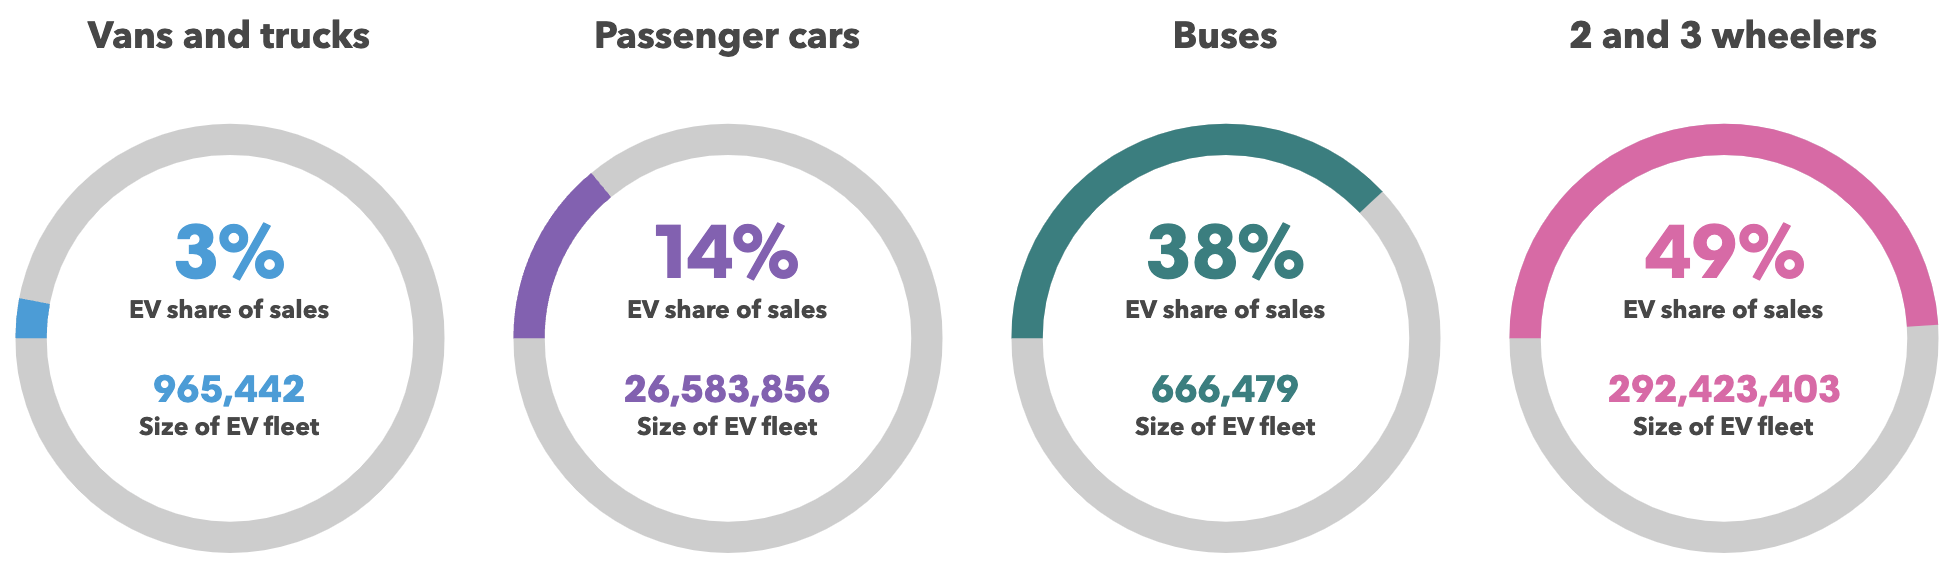
Im not aware of any 2-wheel cars so I assume this refers to e-motor bikes and sit-on e-scooters. I dont know if 2-wheelers also includes battery-assisted pedal bicycles - probably not, although e-bikes and e-scooters (of the stand-on variety) seem to be performing more and more like what we have traditionally called motor bikes.
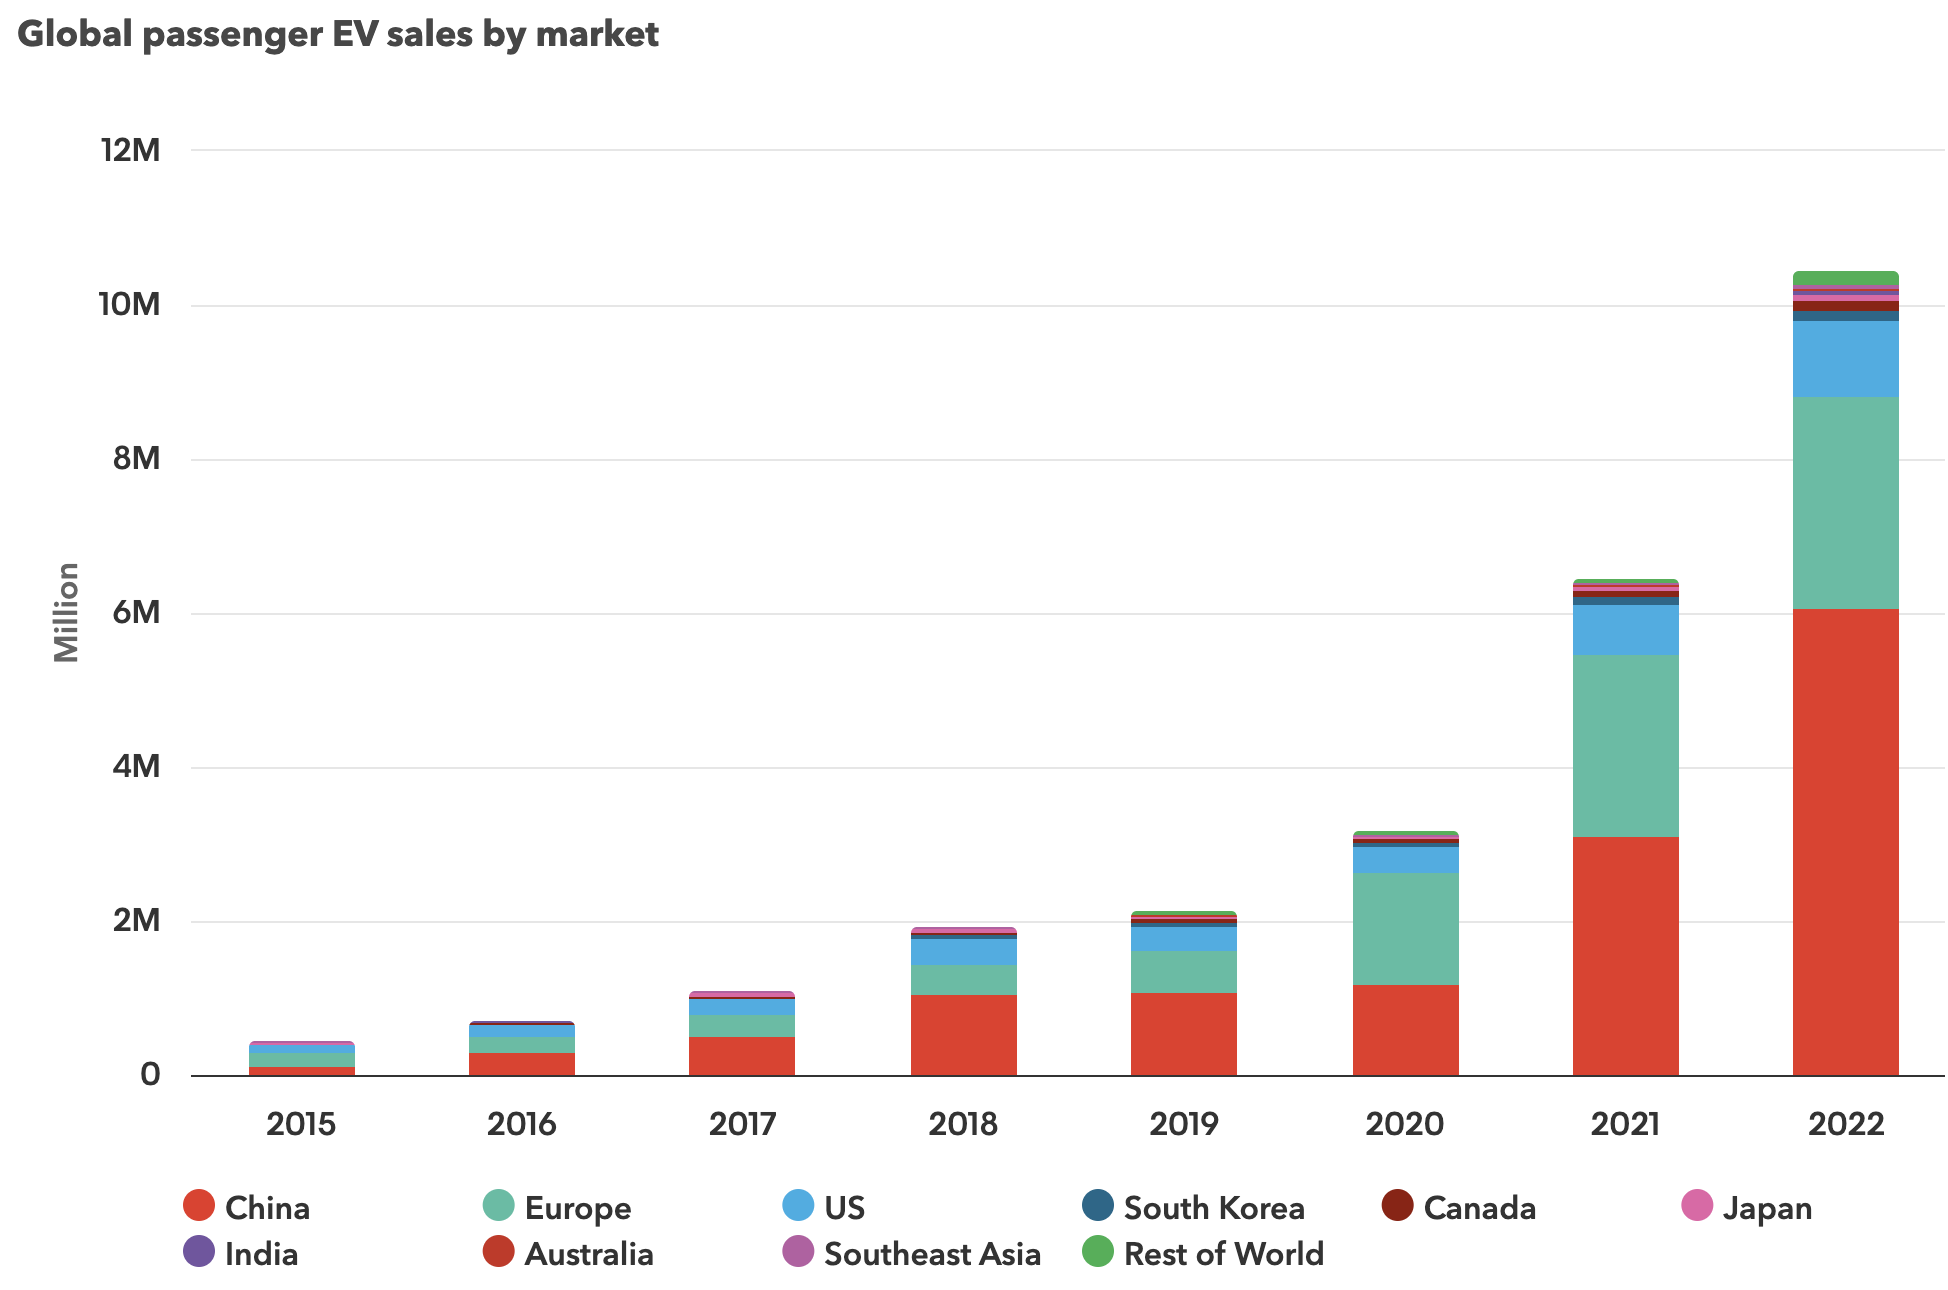
The next graph shows who is buying passenger EVs (cars, Im assuming). Well over half are bought in China. Europe (28 nations) bought less than a third and USA about a tenth.
Finally, who is producing the batteries needed for all these vehicles? No prizes for getting this one correct. The table below relates to the current production of all Li-ion batteries but the picture is similar for the current production of batteries specifically for EVs and also for the growth of EV manufacturing capacity in the coming years.
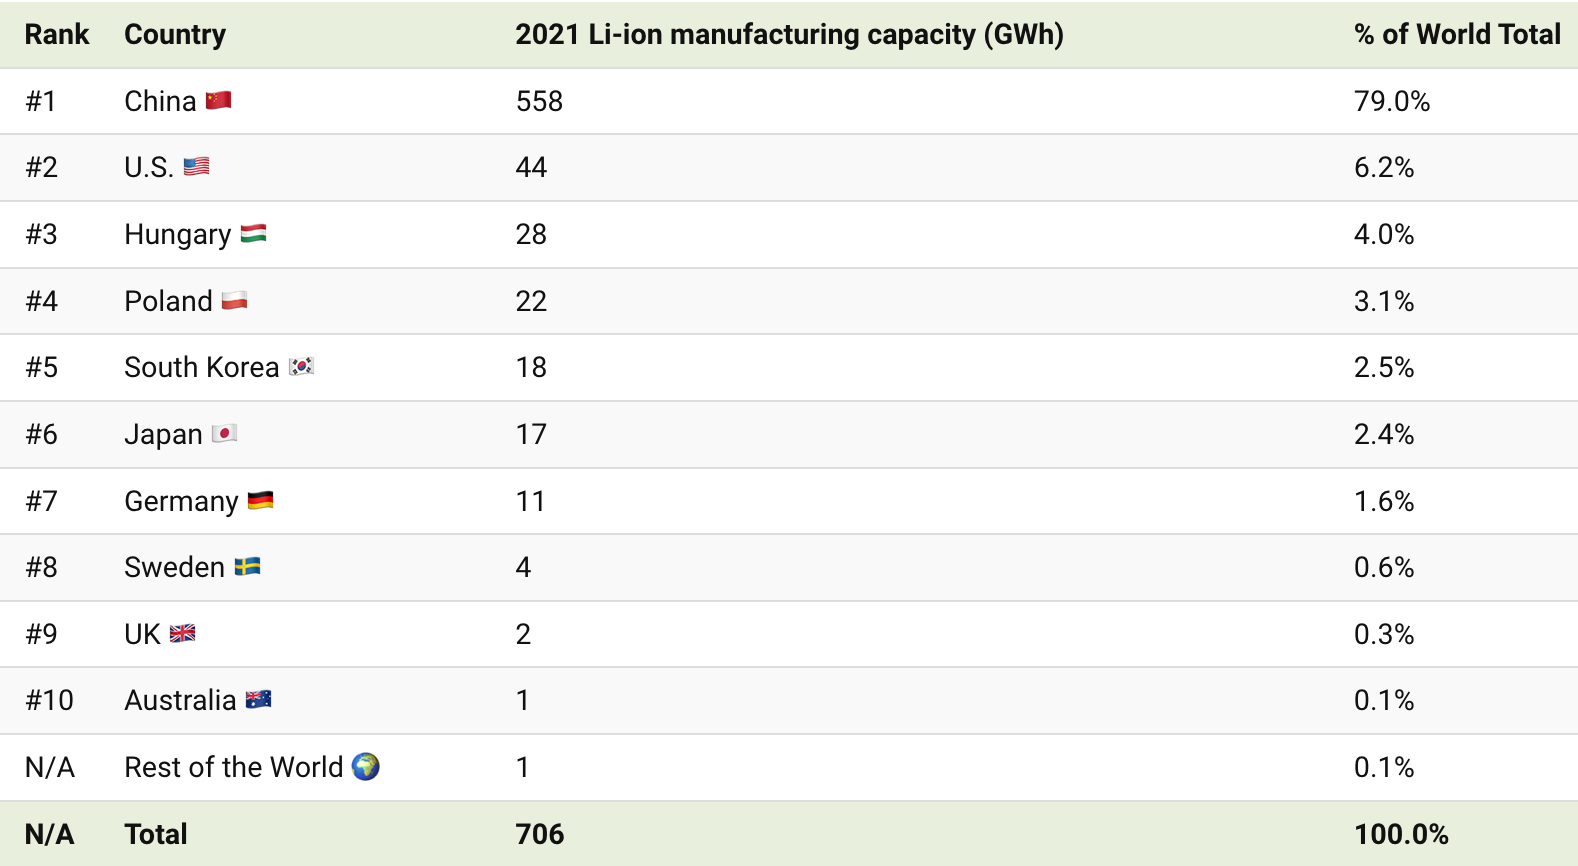
Despite the difficulties associated with linking the different data sets together, it is clear that China is leading the charge towards a battery-driven road transport system, although more emphasis on public transport wouldnt come amiss.
Amphibians in decline
Amphibians are not travelling well in the modern world 40% of species are threatened with extinction, a 40% increase over the last two decades. They are the most threatened class of vertebrates.
South-eastern Australia is one of the worlds hotspots for threatened amphibians. Others include the area around the Caribbean, Central America and tropical Andes, Madagascar, China and much of continental Europe.

(There are fantastic pictures of another 30 amphibians at the bottom of the linked article.)
Historically, the most common threat to amphibians has arisen from habitat loss (principally from the expansion of agriculture but also timber and plant harvesting, and infrastructure development) and disease. This century, habitat loss, disease and climate change have been equally responsible for deteriorations in the threat status of individual species. Habitat protection has contributed most to the status improvements that have occurred.

This is a sharp-snouted day frog, an Australian native. If youd like to see one, bad luck. Its extinct, last seen in 1997. Killed off by the chytrid fungus that is playing havoc with frogs globally.
You can help to keep an eye on the health and distribution of Australian frogs by participating in the annual FrogID Week from November 3-12. During 2022s ID week, batrachophiles identified over 32,000 frogs belonging to 111 species. So, hop to it.
Climate captives
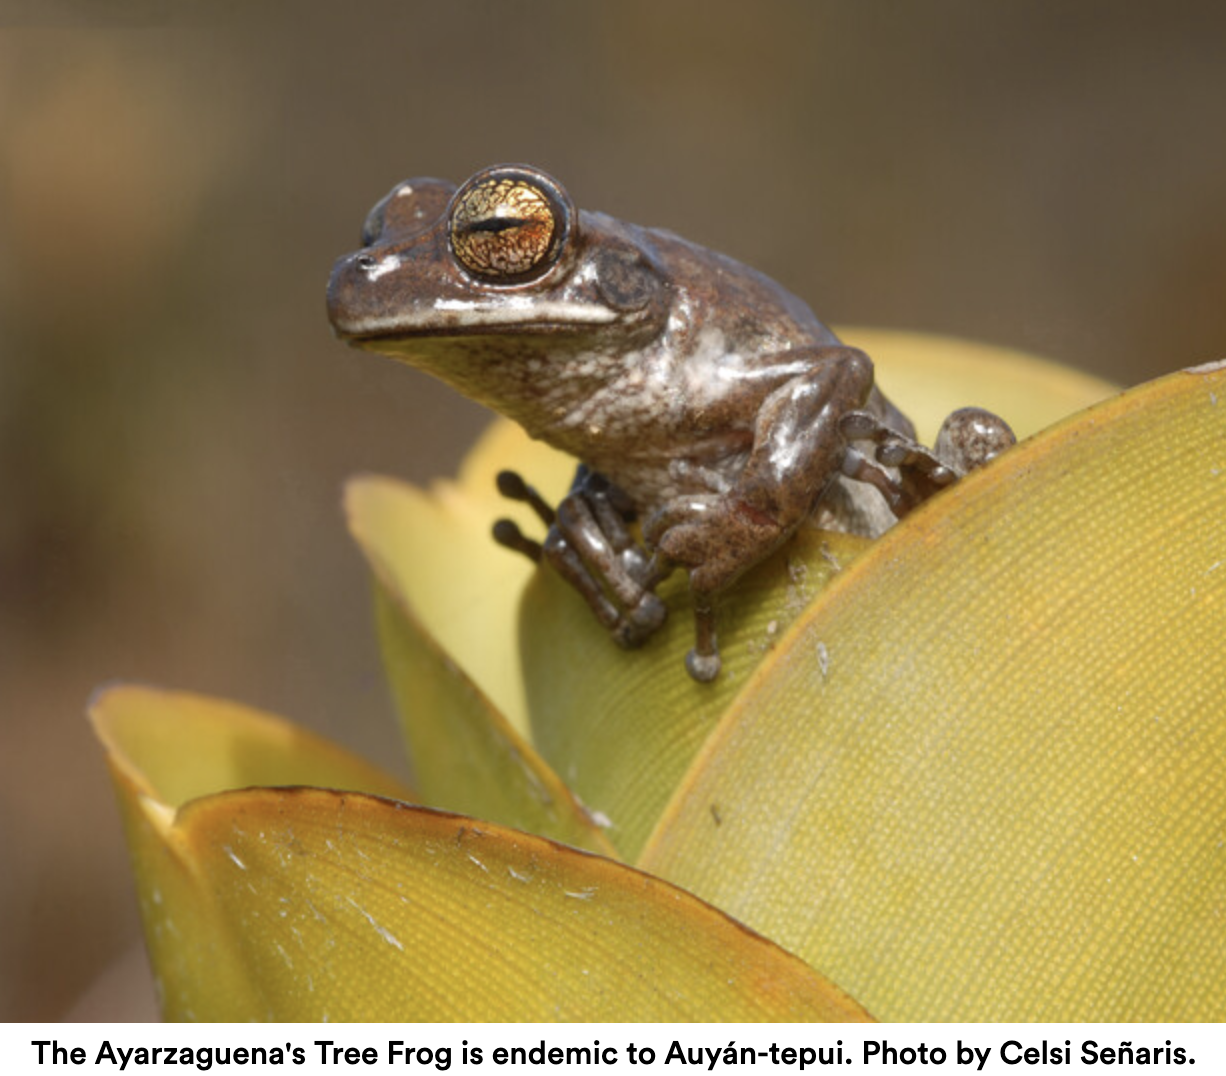
Amphibians are often adapted to live in a narrow range of geographic and meteorological conditions. This is result of their own anatomy and physiology and the presence of particular animals and plants on which they depend for survival. When conditions change, they find it difficult to move or adapt. For instance, as global warming worsens many amphibians become climate captives (rather than climate migrants) because there is literally nowhere liveable for them go.
This is well illustrated in Venezuelas lost world of table-top mountains 1,200-1,500 metres above sea level.