Environment: Oil and gas making massive profits now but stormy waters ahead
March 17, 2024
Shrinking demand signifies rocky times ahead for many individual oil and gas producers but the industry will survive for decades yet. Emissions from farming and forestry aside, Australia’s emissions have been stagnant for 20 years. Feral pigs are destroying our wetlands and rivers.
Drilling into the oil and gas industry (1)
Over the next few weeks, I’ll feature several short pieces that focus on various aspects of the massive oil and gas industry. To start, the International Energy Agency has produced a useful snapshot of the size and future of the industry and the challenges it is facing.
Size:
- The oil and gas industry employs 12 million workers, supplies over half of global energy and generates 18 Gt of CO2 emissions annually.
- The seven large international oil and gas companies that are household names (BP, Shell, ExxonMobil, etc.) control less than 13% of global production and reserves.
- Huge national oil companies (based in Saudi Arabia, Kuwait, Iran, Russia, Nigeria, Venezuela for example) are responsible for more than half of production and almost 60% of reserves.
- Thousands of small private companies and some national oil companies with interests in multiple countries (e.g., the national oil companies of China and India) are responsible for the balances.
- Total annual revenue is around $5 trillion, of which governments get approximately half.
Future:
- The demand for oil and gas is expected to peak this decade but under current policies the decline in use will be nowhere near fast enough to keep warming under 1.5o
- To manage the phase-down of oil and gas use it may be necessary to invest in some existing and some short-lifespan new fields but there is no need for any more exploration.
- Oil and gas producers contribute 1% of the global investment in clean energy. This needs to increase to 50% by 2030.
- Even if the world gets on track to stay under 1.5oC, oil and gas production in 2050 will still be about a quarter of current production, largely for non-combustible uses (e.g., petrochemicals and hydrogen production).
Challenges:
- The production, processing and transport of oil and gas (Scope 1 and 2 emissions – see next item) produce 15% of global energy-related GHGs. These need to be, and can be, reduced (principally by focusing on methane) by 60% by 2030. Emissions must be near zero by 2040 if we are to keep warming under 1.5o
- Carbon capture and storage is essential for some hard-to-abate industries but cannot possibly be used to maintain high production levels for oil and gas. Apart from anything else, the energy required would exceed current global energy use.
- Not all oil and gas producers can be the last ones standing (although they all like to think they will be). Most will need to plan their own disappearance or suffer catastrophic collapse.
- The transition away from burning oil and gas cannot be led only by changes in demand (‘when people stop buying it, we’ll stop producing it’, to paraphrase Darren Woods*, CEO of ExxonMobil) or only by changes in supply (‘if you stop producing it, people will be forced to buy something else or go without’). An orderly transition will need to be collaborative but even then it will be volatile and bumpy. It’s difficult to plan and manage any declining market.
* Paid $54 million in 2022, so not in any hurry to see the company’s fortunes in either sense of the word decline.
Scope 1, 2 and 3 emissions
The laws of physics being what they are, the climate is interested only in the types of greenhouse gas emitted into the atmosphere (CO2, methane, nitrous oxide, etc.) and their amounts. The science doesn’t care about the sources of the various gases.
Human societies do care about the sources. Where are the emissions coming from? Who’s responsible? How can they be controlled? In particular, how can whole industries and individual companies understand where in their production line the GHGs are generated, and how can they be reduced and monitored?
Hey presto, the concept of Scope 1, 2 and 3 emissions to categorise the GHGs produced by companies.
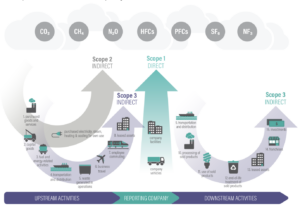
Scope 1: these are the easiest emissions to understand, measure, take action to reduce and monitor because they are the GHGs emitted directly from sources that the company owns or controls. For instance, on its industrial sites and by its vehicle fleet.
Scope 2: are indirect emissions arising from the production of steam, heating and cooling that the company purchases to drive its operations. These are outside the company’s direct control but that’s not to say that they can’t lean on their suppliers to reduce their emissions.
Scope 3: are a second type of indirect emissions that the company cannot directly control. They fall into two groups: (1) those associated with ‘upstream’ products, services and facilities the company must purchase to produce its own products or services. Governments procure large amounts of many products and could exert considerable influence on their suppliers to reduce their own emissions; (2) those associated with the ‘downstream’ uses of a company’s products, services or facilities, for instance when a power station in Japan burns an Australian company’s coal.
As with oil and gas use, controlling the three scopes of emissions requires the attention and cooperation of the suppliers and the purchasers.
Australia’s GHG emissions in a nutshell
The Guardian recently published a very informative series of graphs about Australia’s past, current and projected domestic and exported GHG emissions and the climate consequences. It’s pretty snappy so I won’t try to summarise it any further. To encourage you to have a look though, I will highlight two aspects.
Australia’s total domestic emissions (currently 460 million tons CO2e per year) have been slowly decreasing since about 2008 when they were about 650 mt/year - roughly the same as they had been in 1990. That’s a 30% reduction - not bad, you might think.
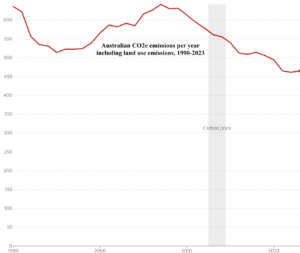
However, the Guardian makes the point that almost all the reduction in emissions has been due to a reduction in land clearing for agriculture and forestry. Land clearing is still occurring at a horrifying scale but it’s less than it was 20 years ago! So, a different picture emerges when the emissions from the land are removed from the total.
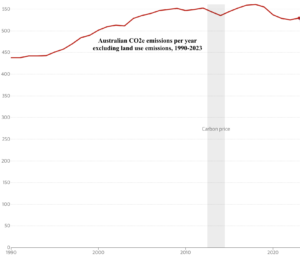
Emissions from the rest of the economy, mainly related to fossil fuels, have fallen only 2.5% since 2005, with almost all the credit going to the electricity generation sector where emissions have fallen 25% in that time.
Confession: I’ve edited out the Guardian’s projections to 2030 in the two graphs above as I want to focus on what’s actually been happening. This is a more realistic guide to what is likely to happen in the near future than what we need to do to limit warming to 1.5oC or have legislated to do to meet our international promises.
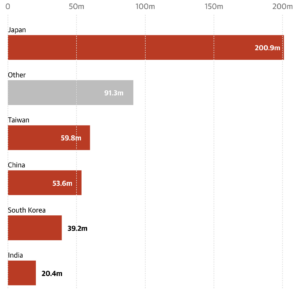
The second issue I’ll draw your attention to concerns Australia’s exported GHG emissions – i.e, the emissions released when the coal and gas (and a little oil) that we dig up and ship out are burnt overseas. These add up to about 1,100 mt/year, well over twice our domestic emissions. Our best customer by far for gas (LNG) and for metallurgical and thermal coal is Japan, illustrated below with the emissions from thermal coal (million tons of CO2e) in 2022/23.
There’s quite a bit more in the Grauniad article. Do have a look for yourself.
Is climate change a US vote changer? Dems say ‘yes’, Reps ‘No’
The bar chart below (from Bloomberg Green Daily newsletter, 29.2.24) shows the response of 5,000 voters in the swing-states of Arizona(B), Georgia(B), Michigan(B), Nevada(B), N Carolina(T), Pennsylvania(B) and Wisconsin(B) to the question: ‘How important, if at all, is climate change when deciding who to vote for in the November 2024 election for U.S. president?’.
(B and T indicates who won the state in 2020.)
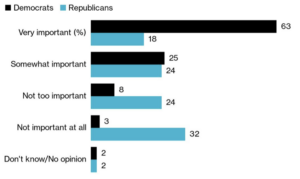
In summary, 88% of Democrats will be influenced by climate change when casting their vote in November but only 42% of Republicans. The good news for Biden supporters/Trump haters is that Biden won all but one of these states in 2020 and Republican voters’ views were probably much the same then. The bad news is that the winning margins were very slim.
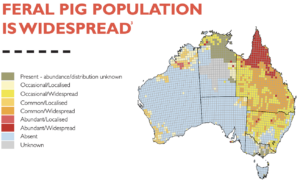
Feral pigs running riot
Feral pigs are a major problem across almost half of Australia. They destroy our natural environment, especially by wallowing and rooting for food in waterways and wetlands. Their activities further endanger at least 148 threatened native animals and plants. Feral pigs are a major source of Japanese Encephalitis Virus for humans and present a significant economic cost to farmers. It’s difficult to arrive at a firm number but there are currently estimated to be about 4 million feral pigs in Australia. For reference, there are about 2.4 million livestock pigs in Australia, mostly in NSW.
The map below demonstrates that feral pig numbers are greatest in Cape York but they are present throughout Queensland and in many areas of NSW and the Northern Territory.