Environment: Peak oil is close but the descent will be slow
August 4, 2024
Peak oil is imminent but it will be a long time before we return to base camp. China surging ahead with solar while continuing to burn coal. NATO produces the equivalent of half of Australia’s annual CO2 emissions.
What if peak oil becomes plateau oil?
The International Energy Agency projects that oil demand will peak globally sometime before 2030. That sounds encouraging – something has to peak before it can fall – but peaking does not guarantee a fall, let alone the much-needed rapid fall to zero. Even if oil demand fell by 50% by 2050, we would still be pumping out lots of greenhouse gases and fuelling further climate change.
And what if oil demand peaked but then remained very high – plateau oil, so to speak.
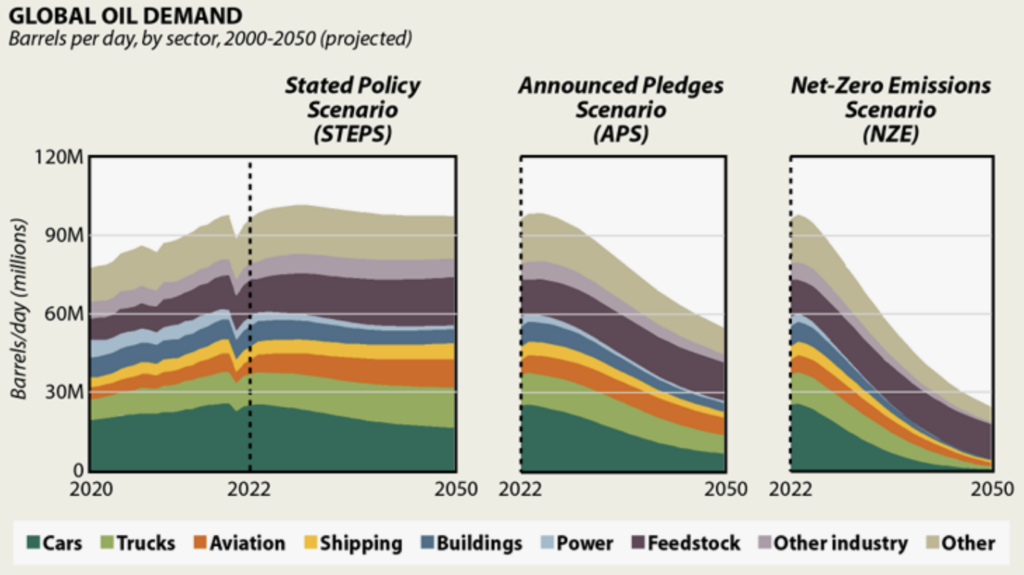
The charts above model oil demand in millions of barrels per day (mbd) between now and 2050 based on three different assumptions about the actions governments take to tackle global warming:
- The STEPS scenario relates to a long-term continuation of current policies. Yes, oil demand peaks at about 100 mbd around 2030 but it falls very little after that and is still well above 90 mbd in 2050.
- The APS scenario assumes that all countries meet their current announced climate goals – unlikely but a useful exercise. Oil demand peaks around 2025 and then falls steeply to about 50 mbd in 2050, approximately 50% of current consumption.
- The NZE scenario displays what needs to happen to oil demand for emissions to reach net zero by 2050. Oil demand again peaks around 2025 and then falls rapidly to about 25 mbd in 2050. That’s probably what it was around 1960 and would generate about 3 billion tonnes of CO2 per year, so hardly ‘nothing’, and it would leave a lot of work for plants and technology to do mopping up CO2 in the air to reach net
The big difference between STEPS and NZE is that in STEPS only the power sector and cars reduce their oil demand between now and 2050, whereas in NZE all sectors except feedstock and the ragbag ‘other’ decline to almost nothing.
This is all just a mind game, of course, but it does illustrate the difference between what might well happen if we let the oil and gas industry have its own way (STEPS), the best we can probably hope for unless ordinary folk all around the world demand climate action (APS), and what the science tells us we need to do (NZE).
STEPS isn’t even the worst case possibility. Should Presidents Trump and Putin rule the roost next year, peak oil may dip for a few years and then rise again to an even higher peak – twin peaks oil.
Confirming my scepticism, a recent report from BP forecasts that oil consumption will peak next year at 102 mbd but remain at 80-98 mbd in 2035, 5-10% higher than their previous forecasts. Their most optimistic forecast for 2050 is almost 30 mbd.
BP’s thoughts on gas consumption are even more depressing - at best a 50% reduction on 2022 levels by 2050 (which would produce about 4 billion tonnes of CO2 per year) but possibly a 20% increase (producing about 9 billion tonnes of CO2 per year).
So yes, we need to get to reach peak oil soon but that is not the destination; it’s just the first, much-delayed milestone on a long and now necessarily quick journey. Unfortunately, we seem to be stuck at the station.
China’s changing power mix
China, rightly, is the poster-child for constructing, exporting and installing renewable energy facilities. The growth in its generation of solar power is particularly impressive.
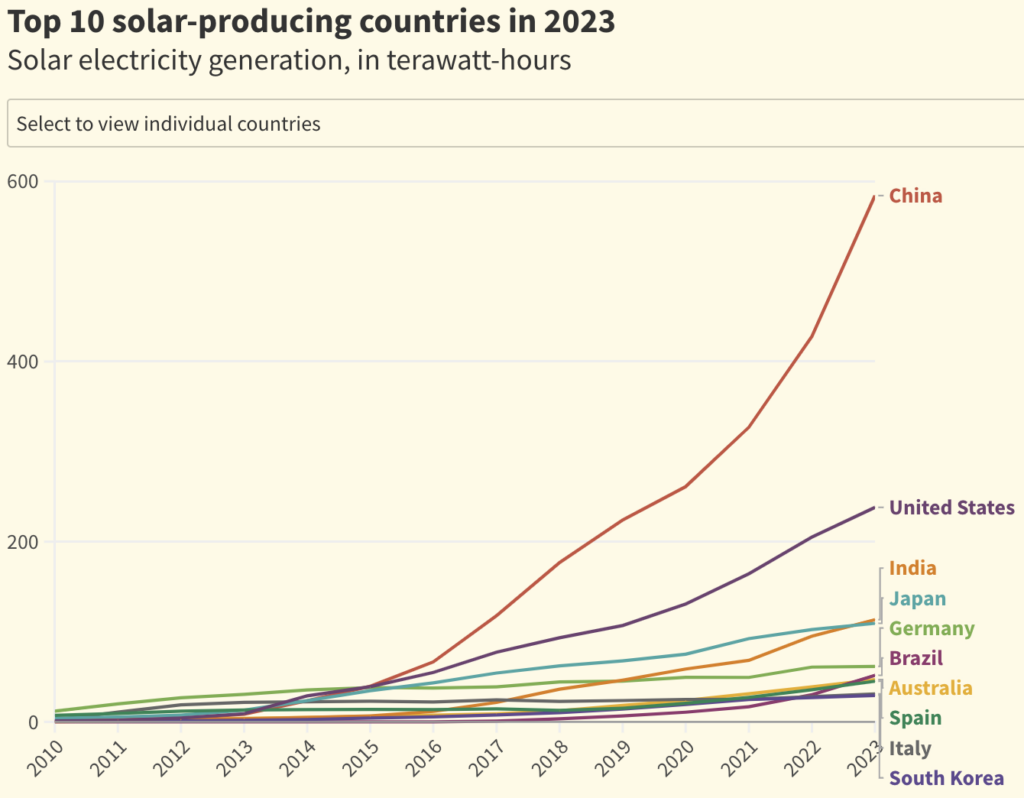
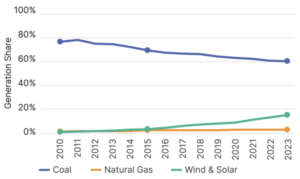
Wind and solar power generation in China has grown at a compound annual rate of 26% since 2015, an overall increase of 1,250 terawatt hours (TWh). As a result, wind and solar’s market share in China has increased from 4% in 2015 to 16% in 2023. This has been at the expense of coal, the share of which has decreased from 80% in 2011 to 70% in 2015 to 61% in 2023. Gas has remained steady at 3%.
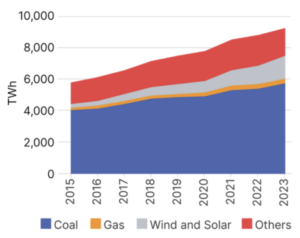
But, as ever, percentages can be misleading, as the next graph shows. Coal’s share may have fallen but it’s actual use in power generation has been steadily increasing because China’s overall demand for power keeps increasing at over 6% per year.
China’s intentions are clear, however – demonstrated in the next graph of annual capacity additions from 2012 to 2023.
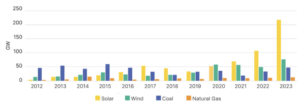
Solar, wind, coal and natural gas were all chugging along at relatively low levels of new capacity until 2019, since when the annual additions have doubled for wind and quintupled for solar, reaching 217 GW in 2023. China’s combined wind and solar capacity could exceed 1,300 GW this year. For comparison, Australia’s total electricity capacity is 55 MW (yes, megawatts, not gigawatts).
Renewable energy will probably provide almost 50% of China’s electricity by 2028.
The fly in the ointment, of course, is China’s increasing demand for electricity. An annual 6.3% increase in demand leads to a doubling every 11 years and greenhouse gas emissions from burning coal (and gas) may not decline much, or even at all, in the foreseeable future even if their market shares fall markedly.
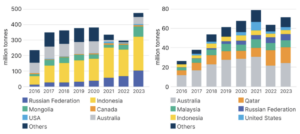
The consequences of China’s power shift for Australian fossil fuel exports to China are already emerging. Exports of coal (left histogram below) fell dramatically in 2021 and 2022 before picking up in 2023, while LNG exports (right histogram) peaked in 2021.
NATO’s contribution to climate change
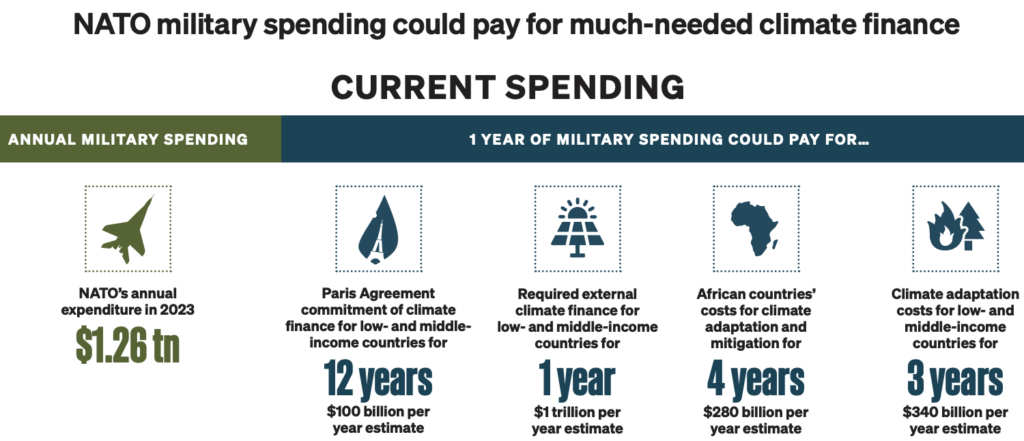
In 2023 military expenditure by the 31 members of NATO totalled US$1.34 trillion, of which the USA contributed about 70% and the UK, Germany and France collectively coughed up 15%. Apart from defending democracy (unless the CIA doesn’t like the outcome of your elections), freedom of speech (unless you’re called Assange) and the ability of arms manufacturers and dealers to make enormous profits, these outlays produced 233 Mt CO2e, about half of Australia’s annual emissions. It was also a 15% increase on 2022, despite an annual decrease of at least 5% per year being needed to keep global warming under 1.5oC. When all is said and done though, it’s more important for today’s humans to fight each other than for us to accommodate the laws of physics to preserve humanity’s future.
NATO’s F-35 combat aircraft, produced by Lockheed Martin, by far the major corporate beneficiary of NATO’s expenditure, consumes 5,600 litres of oil per hour, enough to keep most reasonable-sized family cars on the road for about ten years. But it’s an impressive machine: ‘a joint All-Domain force multiplier, the most advanced node in 21st Century Warfare, seamlessly sharing information across every domain [to] provide unprecedented situational awareness [and] vital information needed to win the fight’. And it kills people.
The figure below suggests some alternative uses for NATO’s 2022 expenditure (US dollars).
Climate change: what do people around the world think?
The United Nations Development Program and the University of Oxford have conducted the second People’s Climate Vote. Telephone interviews were conducted with almost 74,000 people (selected with random digit dialling) in 77 countries.
In the table below I have displayed the results for Australia, South Africa and the whole world. Both countries are remarkably close to the global average on many of the measures. Most interesting to my mind are the views of South Africans who, despite their pressing personal and national problems, know about climate change and are worried about it.
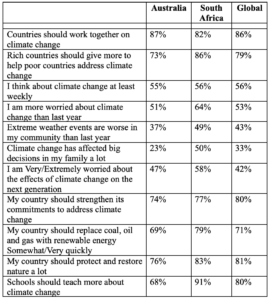
Don’t be fooled, however, by the relative consistency of the results I’ve selected. There were some countries where the people were much less interested in climate change: Saudi Arabia, Russia, Czech Republic, China and even Germany for example.
Generally speaking, the respondents were unimpressed by their own government’s and big business’s efforts to tackle climate change. ‘Somewhat well’ and ‘Neither well nor badly’ (around a half combined) garnered the most votes.
Leopardwood tree

I spent the last two weeks on an extremely enjoyable road trip through the outback of northern NSW and Queensland as far north as Winton, country that was previously unknown to me.
At Yantabulla, halfway between Burke and the Currawinya National Park, I saw the Leopardwood or leopard tree pictured above. Flindersia maculosa, to give it its scientific name (macula, Latin for spot or stain, as in immaculate), is found in inland areas of eastern Australia.
The drawings below are by Margaret Flockton (1861-1953), a noted botanical artist. If ever you have the chance, I strongly encourage you to see the wonderful botanical illustrations entered in the annual Margaret Flockton Award at Sydney’s Royal Botanic Gardens.


