Environment: Putting a price on carbon: is it worth all the trouble?
March 2, 2024
Economic theory supports a price on carbon but implemented schemes struggle to deliver emissions reductions. China firmly in the EV driving seat. Climate action is failing to meet its targets globally.
Do carbon pricing mechanisms work?
Almost every economist agrees (see Michael Keating and St Ross) that the most efficient, most effective, lowest cost, most flexible and fairest way to make significant inroads into emissions of CO2 is to put a price on carbon a tax or an emissions trading scheme. The theory sounds good: fossil fuels are cheap because the externalities (the costs of the social and environmental damage they cause) are not included in the price consumers pay for the fuel. Plus, theres the subsidies many governments are paying fossil fuel industries.
According to the economic logic, making fossil fuel industries pay for the social and environmental damage their emissions cause will encourage them to reduce their emissions to keep down the price and maintain competitiveness amongst themselves and with renewables.
On the other hand, almost every politician agrees that passing legislation to implement a carbon pricing scheme is fraught Australia is, of course, the only country to date to pass legislation to remove a carbon pricing scheme.
With all the good economic logic and political angst that has accompanied carbon pricing all over the world during the last 20 years, you would think wed know whether it works or not at reducing emissions. But apparently we dont know much and what we do know isnt very reassuring, according to a 2021 review.
Since 1990, only 37 studies, mostly in Europe, have examined the effect that the introduction of a carbon price has had on the jurisdictions CO2 emissions.
To the extent that evidence ever changes peoples prejudices, the findings of the meta-analysis of the 37 will rattle a few cages:
- The amount and quality of the evidence is low. A critical observer might wonder whether the results of any decent studies that have produced negative findings have been suppressed by vested interests. But that would be uncharitable.
- Although the findings of the 37 individual studies vary somewhat, the overall reduction in CO2 emissions after the introduction of a carbon pricing scheme is around 0-2% per year. Thats not much good to the rich G20 nations who must reduce their emissions by 11% per year between now and 2030 to stand a 50-50 chance of limiting warming to 1.5o And as attentive readers are aware, emissions are still increasing anyway.
- In this dismally performing field of pricing mechanisms, carbon taxes (16 studies) performed a little better than emissions trading schemes (19 studies). Two studies included both.
Why might the results have been so disappointing? Briefly, maybe the carbon prices are not high enough to incentivise emissions reductions; maybe the fossil fuel burners move their activities to a jurisdiction that doesnt have a carbon price; maybe where there are emissions trading schemes the fossil fuel industries are buying cheap, and probably useless, carbon offsets rather than reducing their emissions; and, unlikely as it sounds, maybe the law makers and regulators have been captured by the industry, resulting in a carefully crafted scheme that can be talked up but achieves little.
The question is, do we need better schemes or better research?
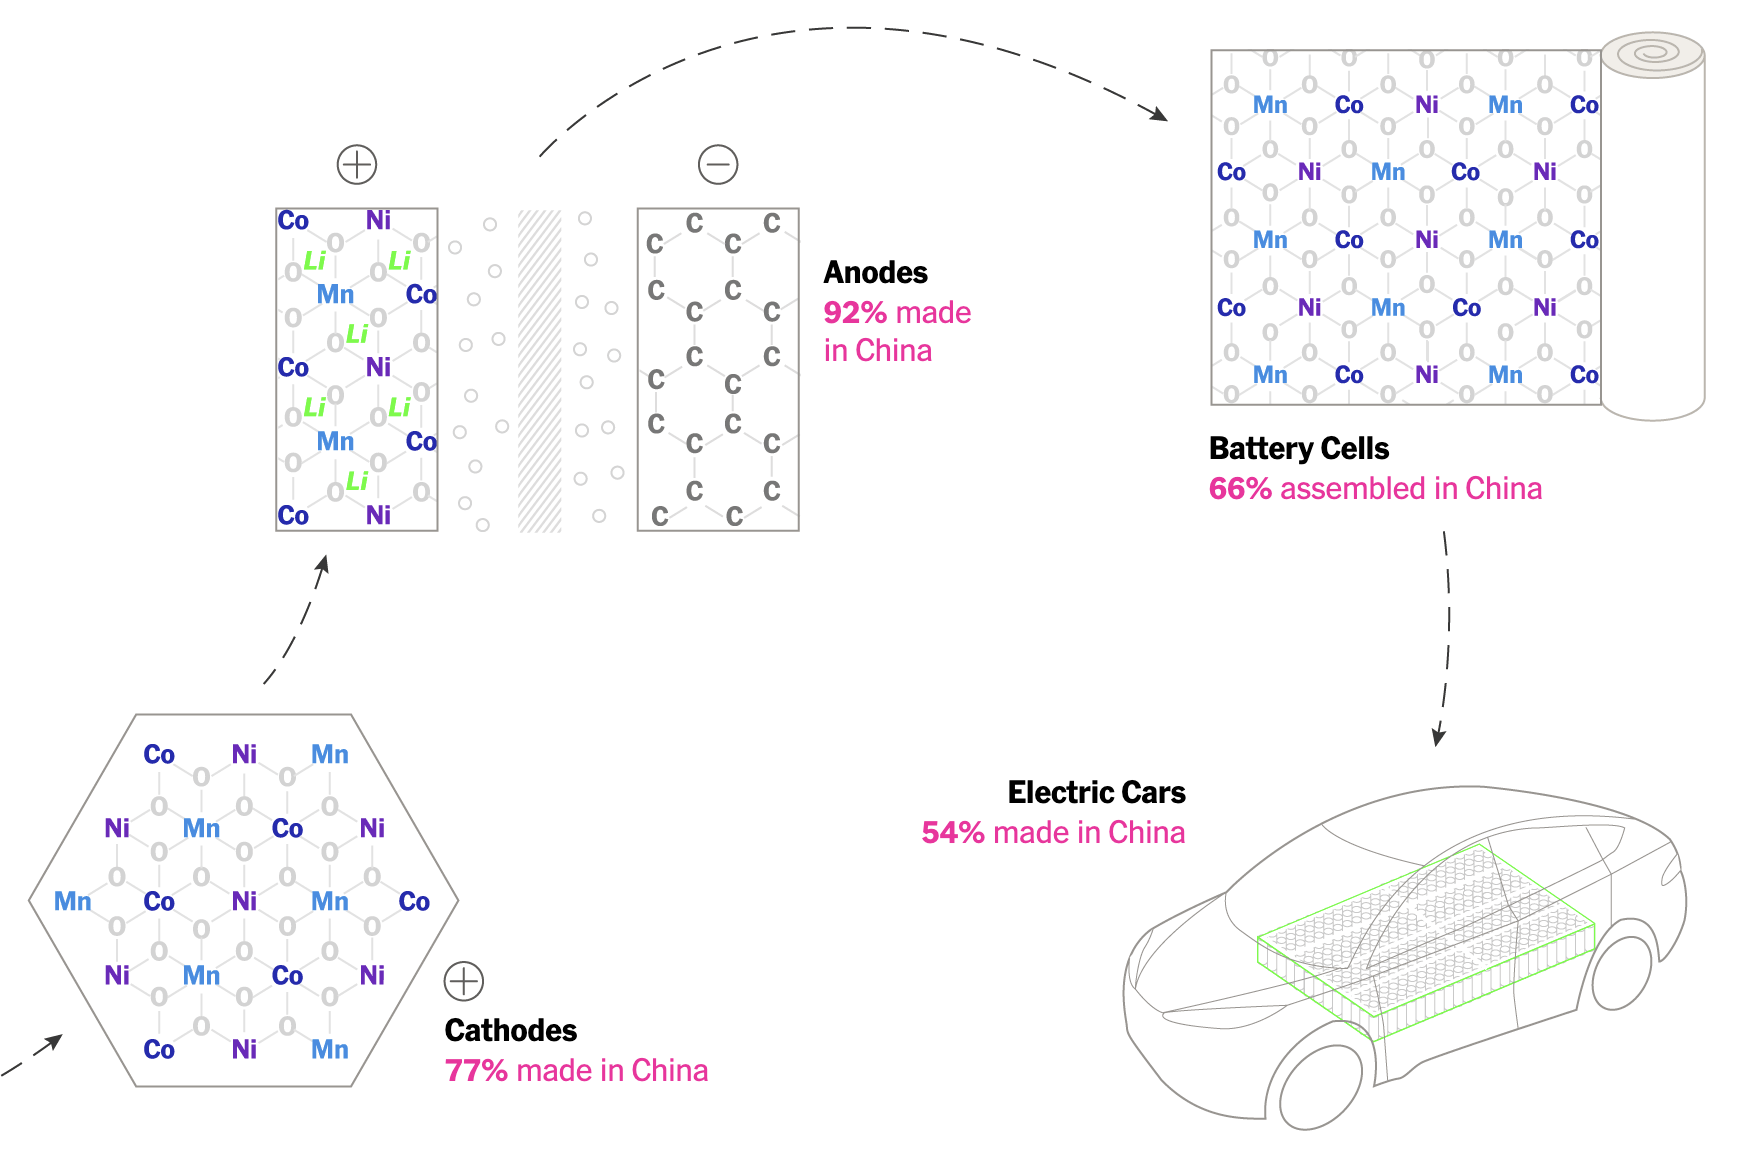
Who controls the supply of EVs
China controls the supply of EVs!
If you have any doubts about that, have a look at the following figures that demonstrate why in 2021 China manufactured 54% of the worlds EVs (around 57% in 2023).

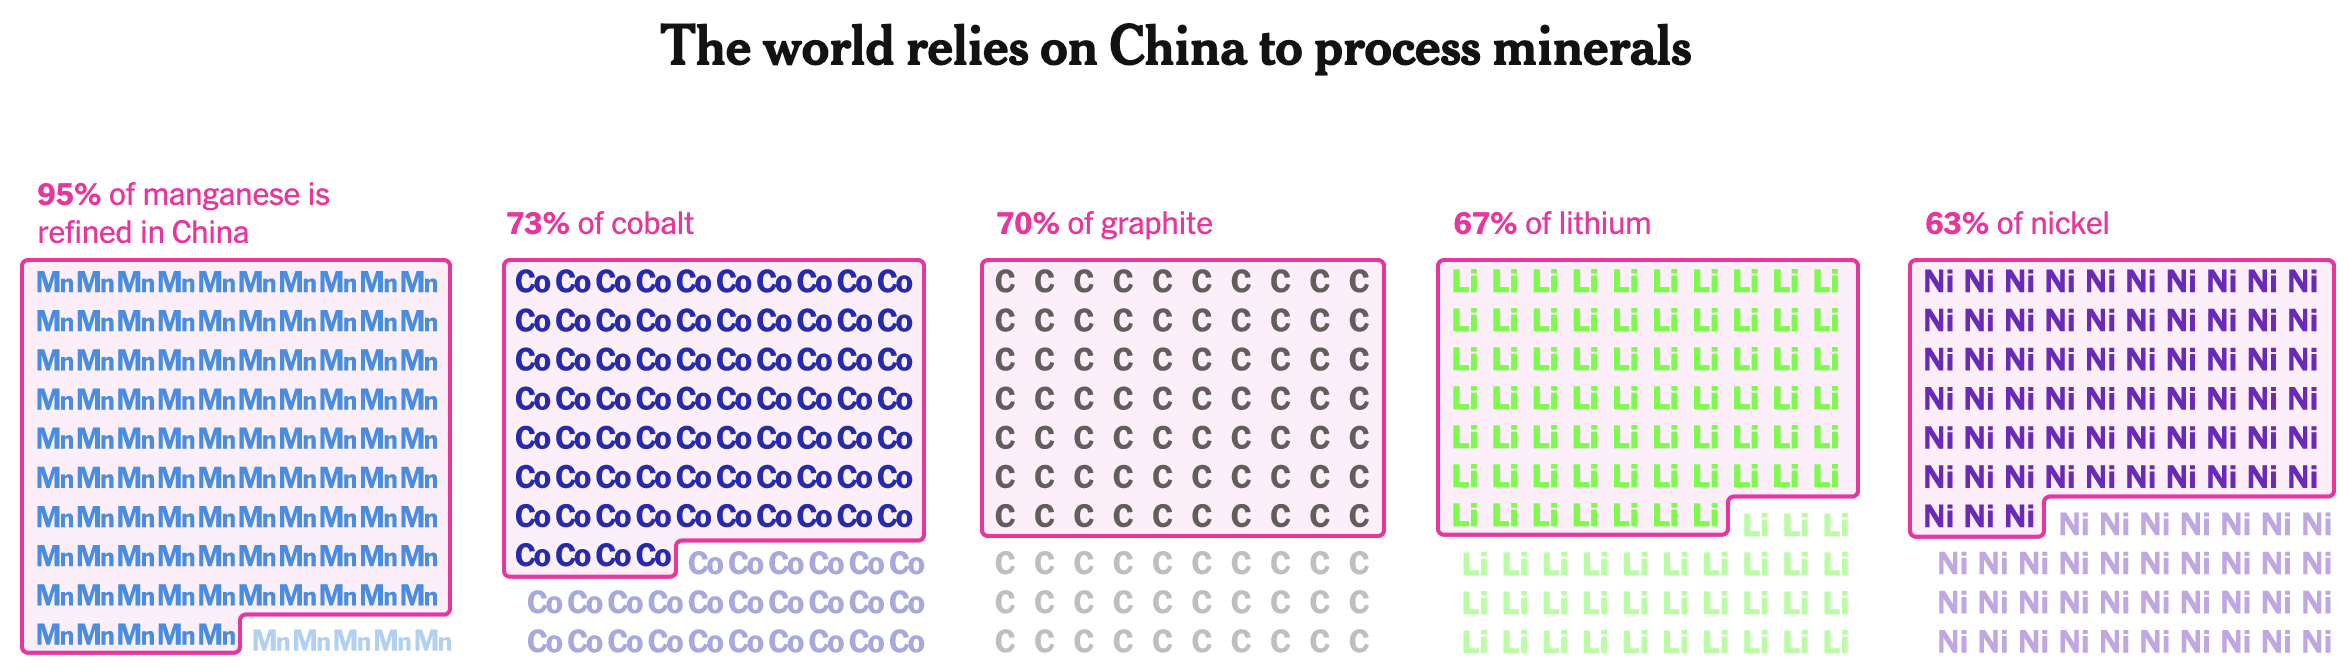
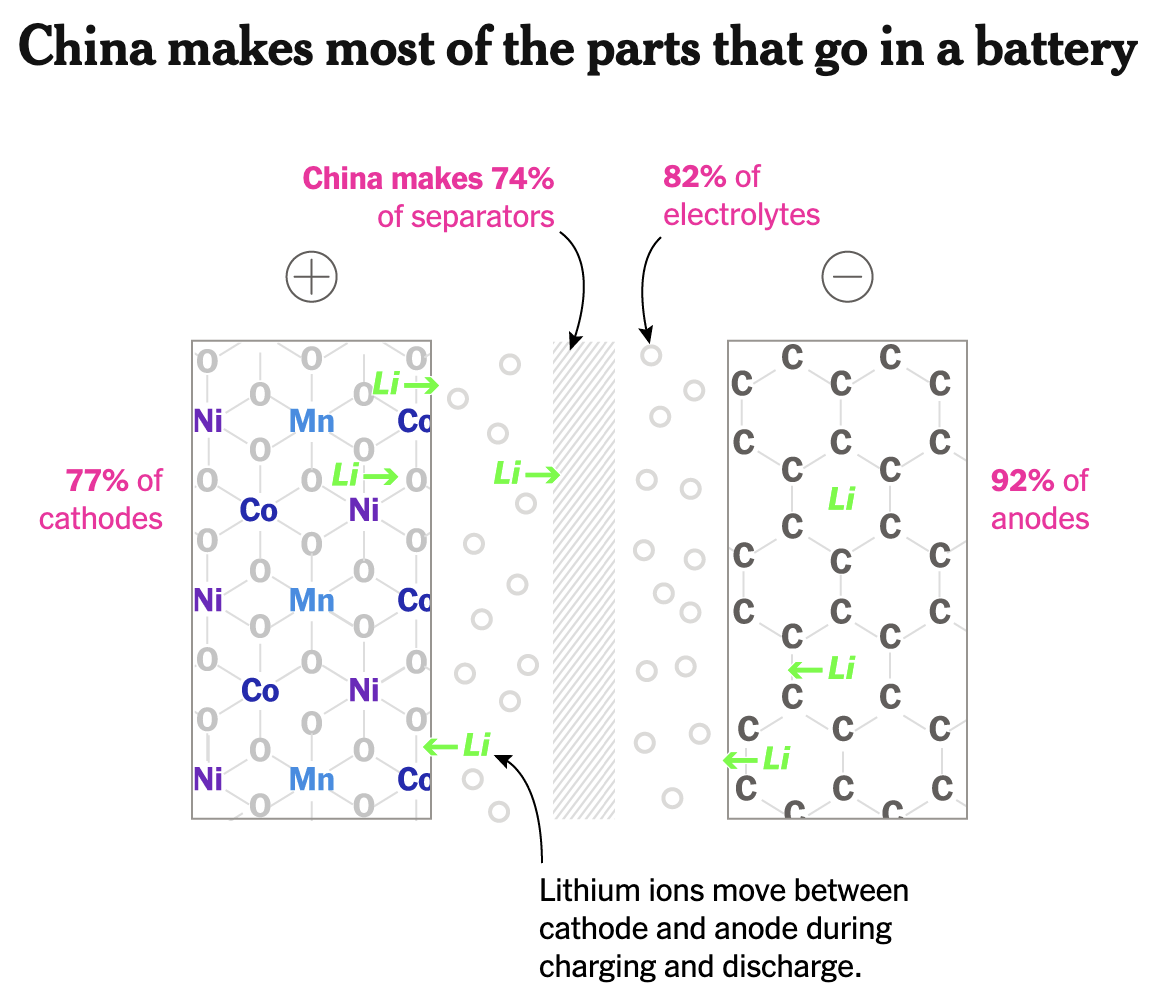
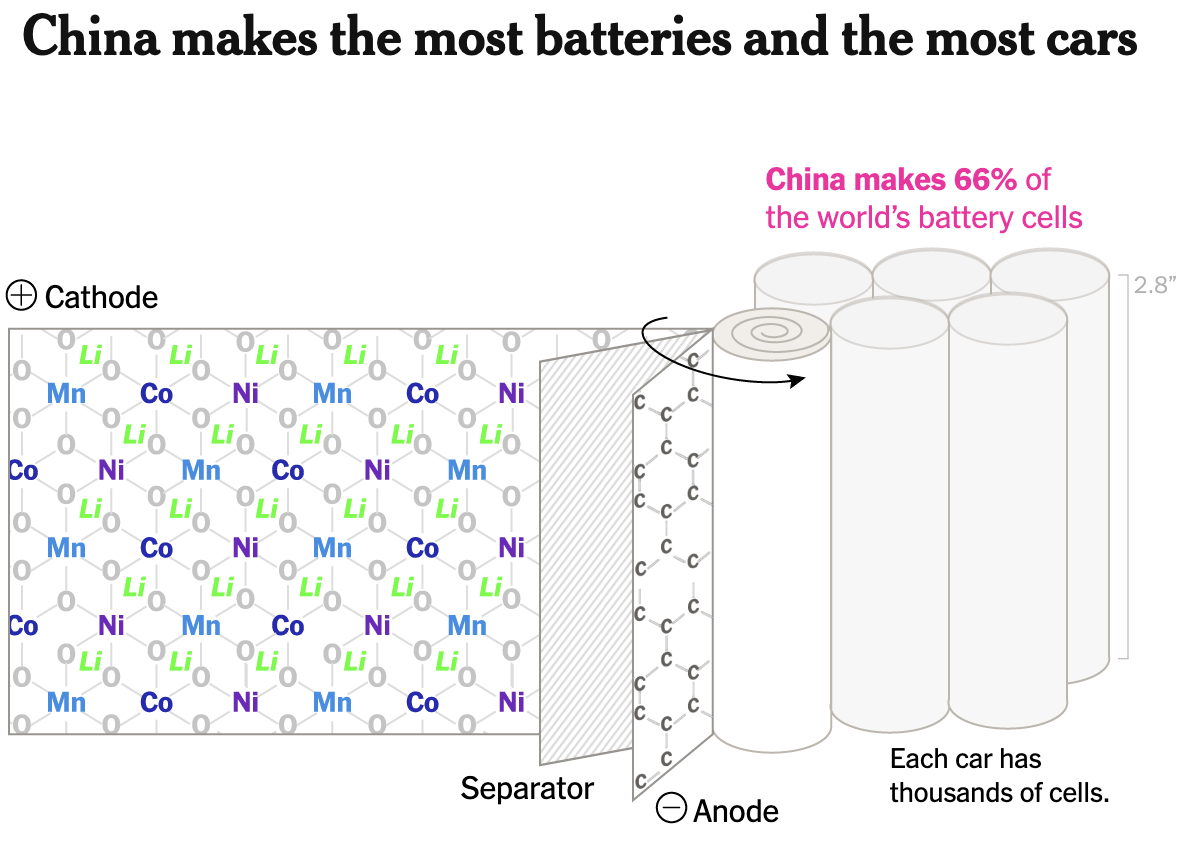
And that all results in China controlling the whole production line.
Im not complaining at all. China saw the future and made the investments. Good luck to them - they have beaten the West at their own game.
Natures heartbeat
Gross Primary Productivity (GPP) is the total amount of carbon compounds produced by photosynthesis in a terrestrial ecosystem in a given period. Its a reflection of the amount of solar energy captured. The carbon compounds support not just the plant that produces them but also other forms of life that feed on the alive or dead plant and so on up the food chain.
The GPP in an ecosystem varies by location (for instance, tropical areas are more productive than higher latitudes and deserts have low productivity), as the ecosystem changes (for instance, with ecological succession and climate change) and with the seasons more productivity in summer, less in winter. Add up the GPP of all the land-based ecosystems around the world and you have the global GPP. Thats pretty much exhausted my knowledge on the topic.
Some of those clever IT types have produced animated videos of the changing GPP around the world during the year. The surface area of countless small plots of land are electronically resized to reflect each ones GPP each month. If you watch the Natures heartbeat video, youll see the annual summer pulse of life around the world. It all happens very quickly in the video, so Ive taken screenshots of January and July so that you can compare them more easily.
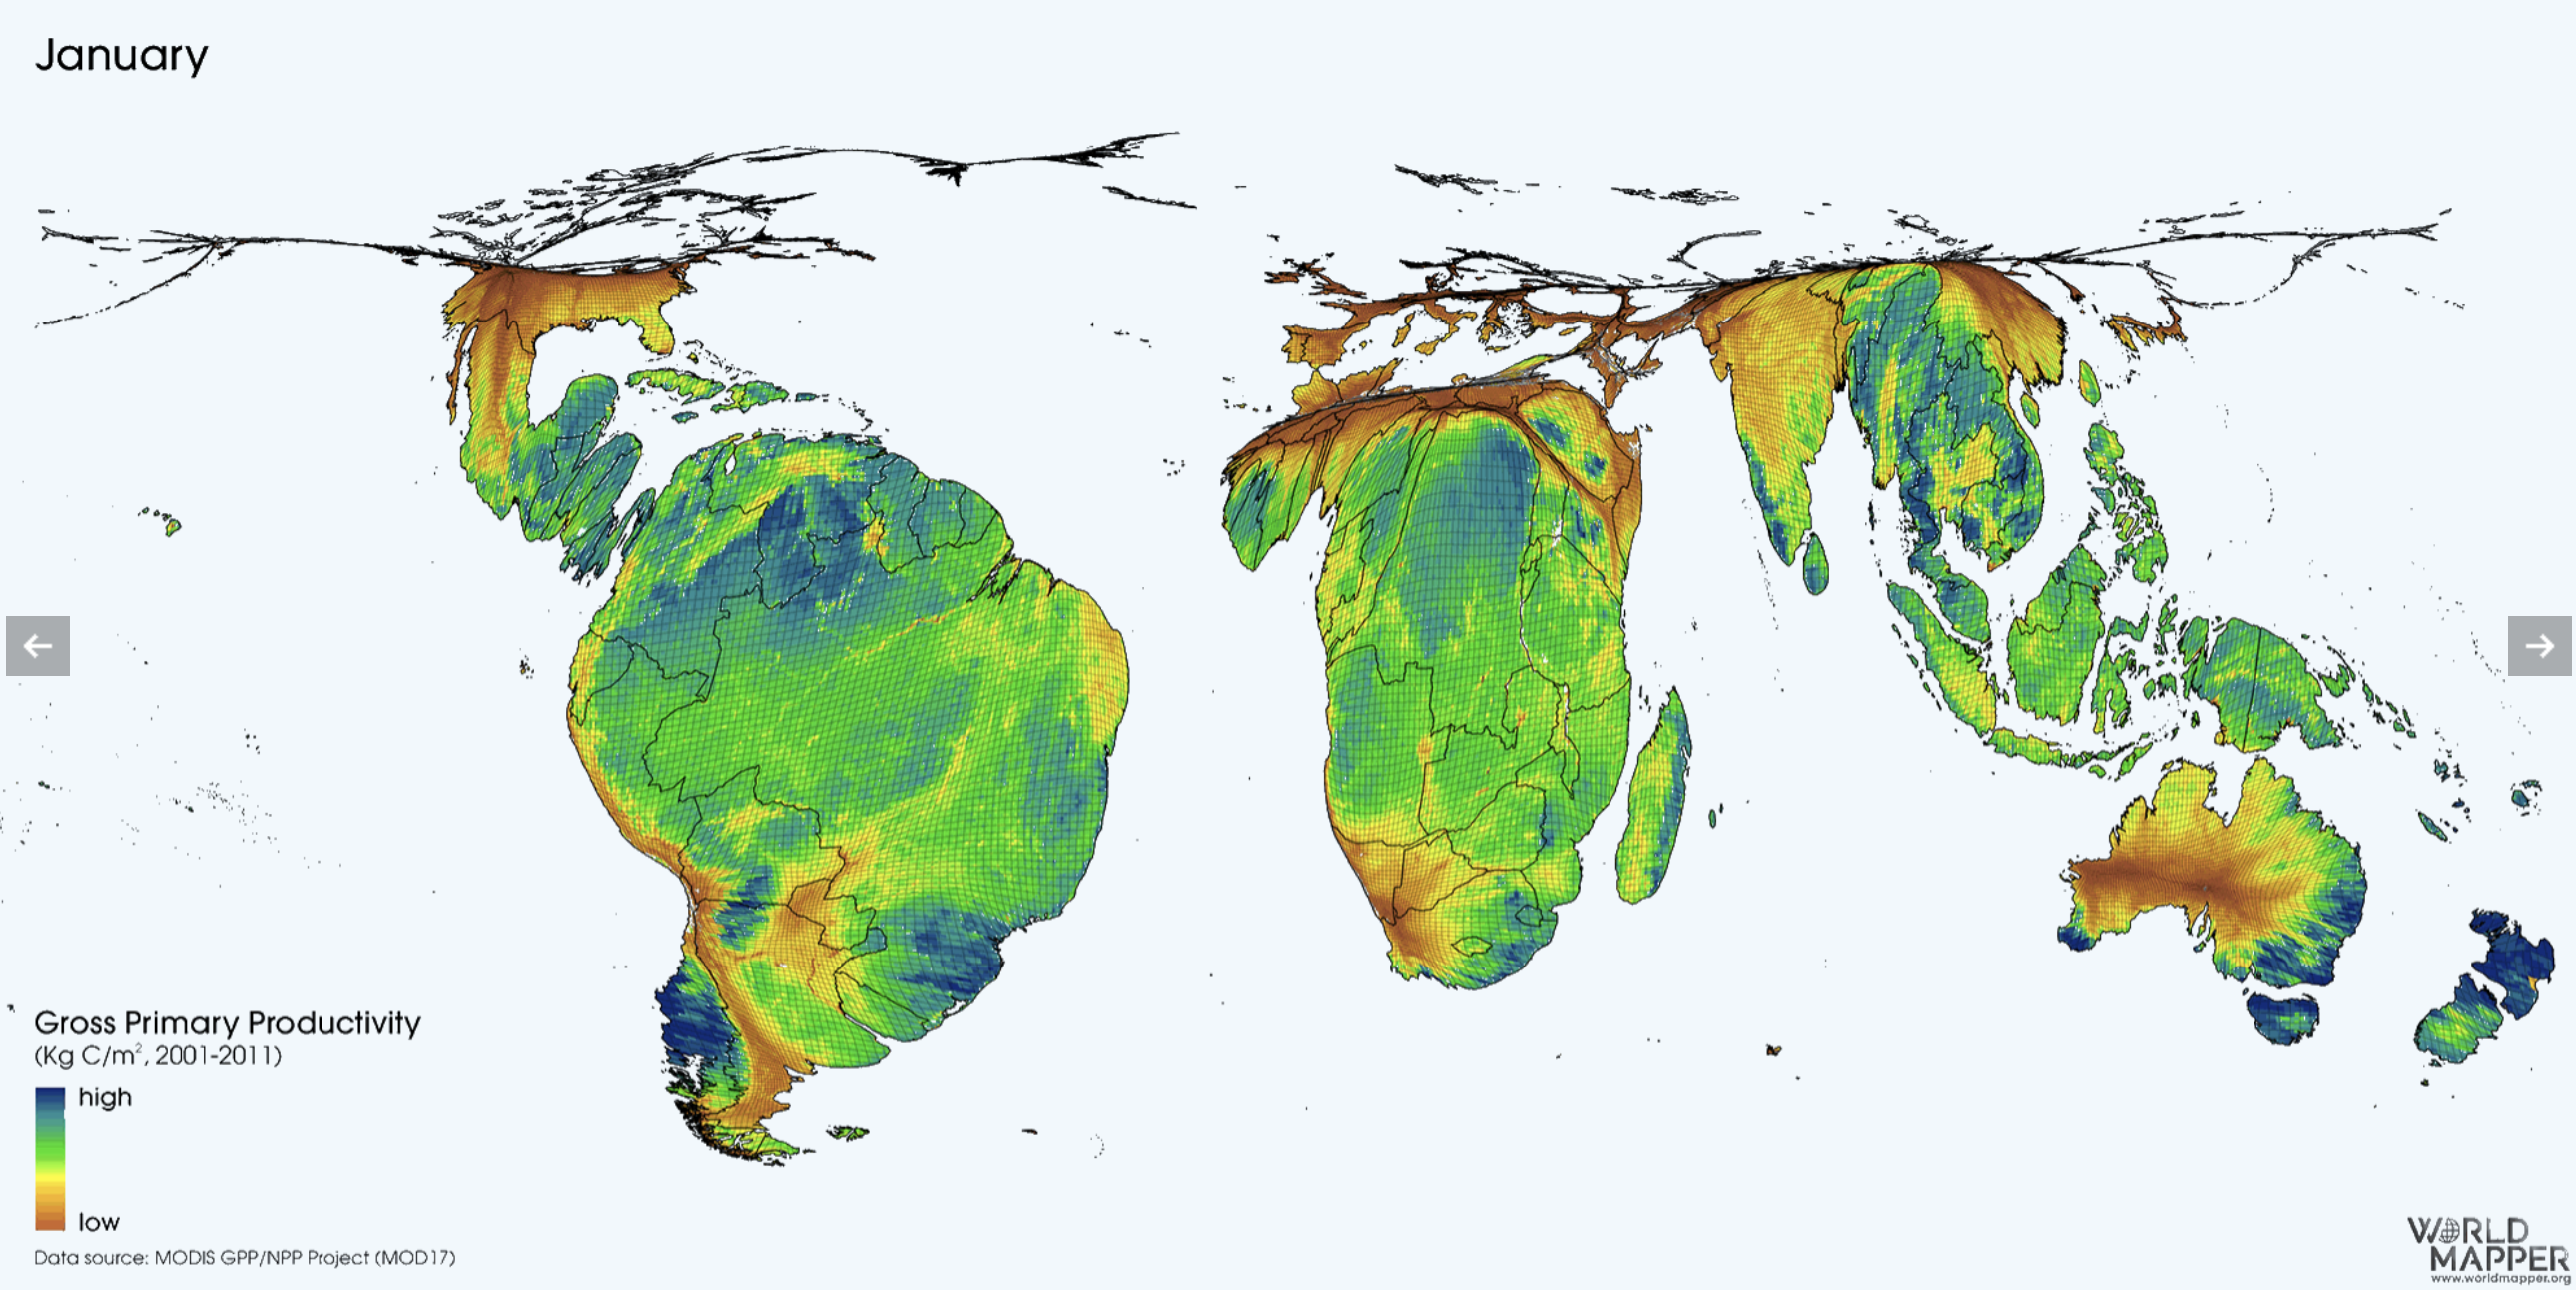
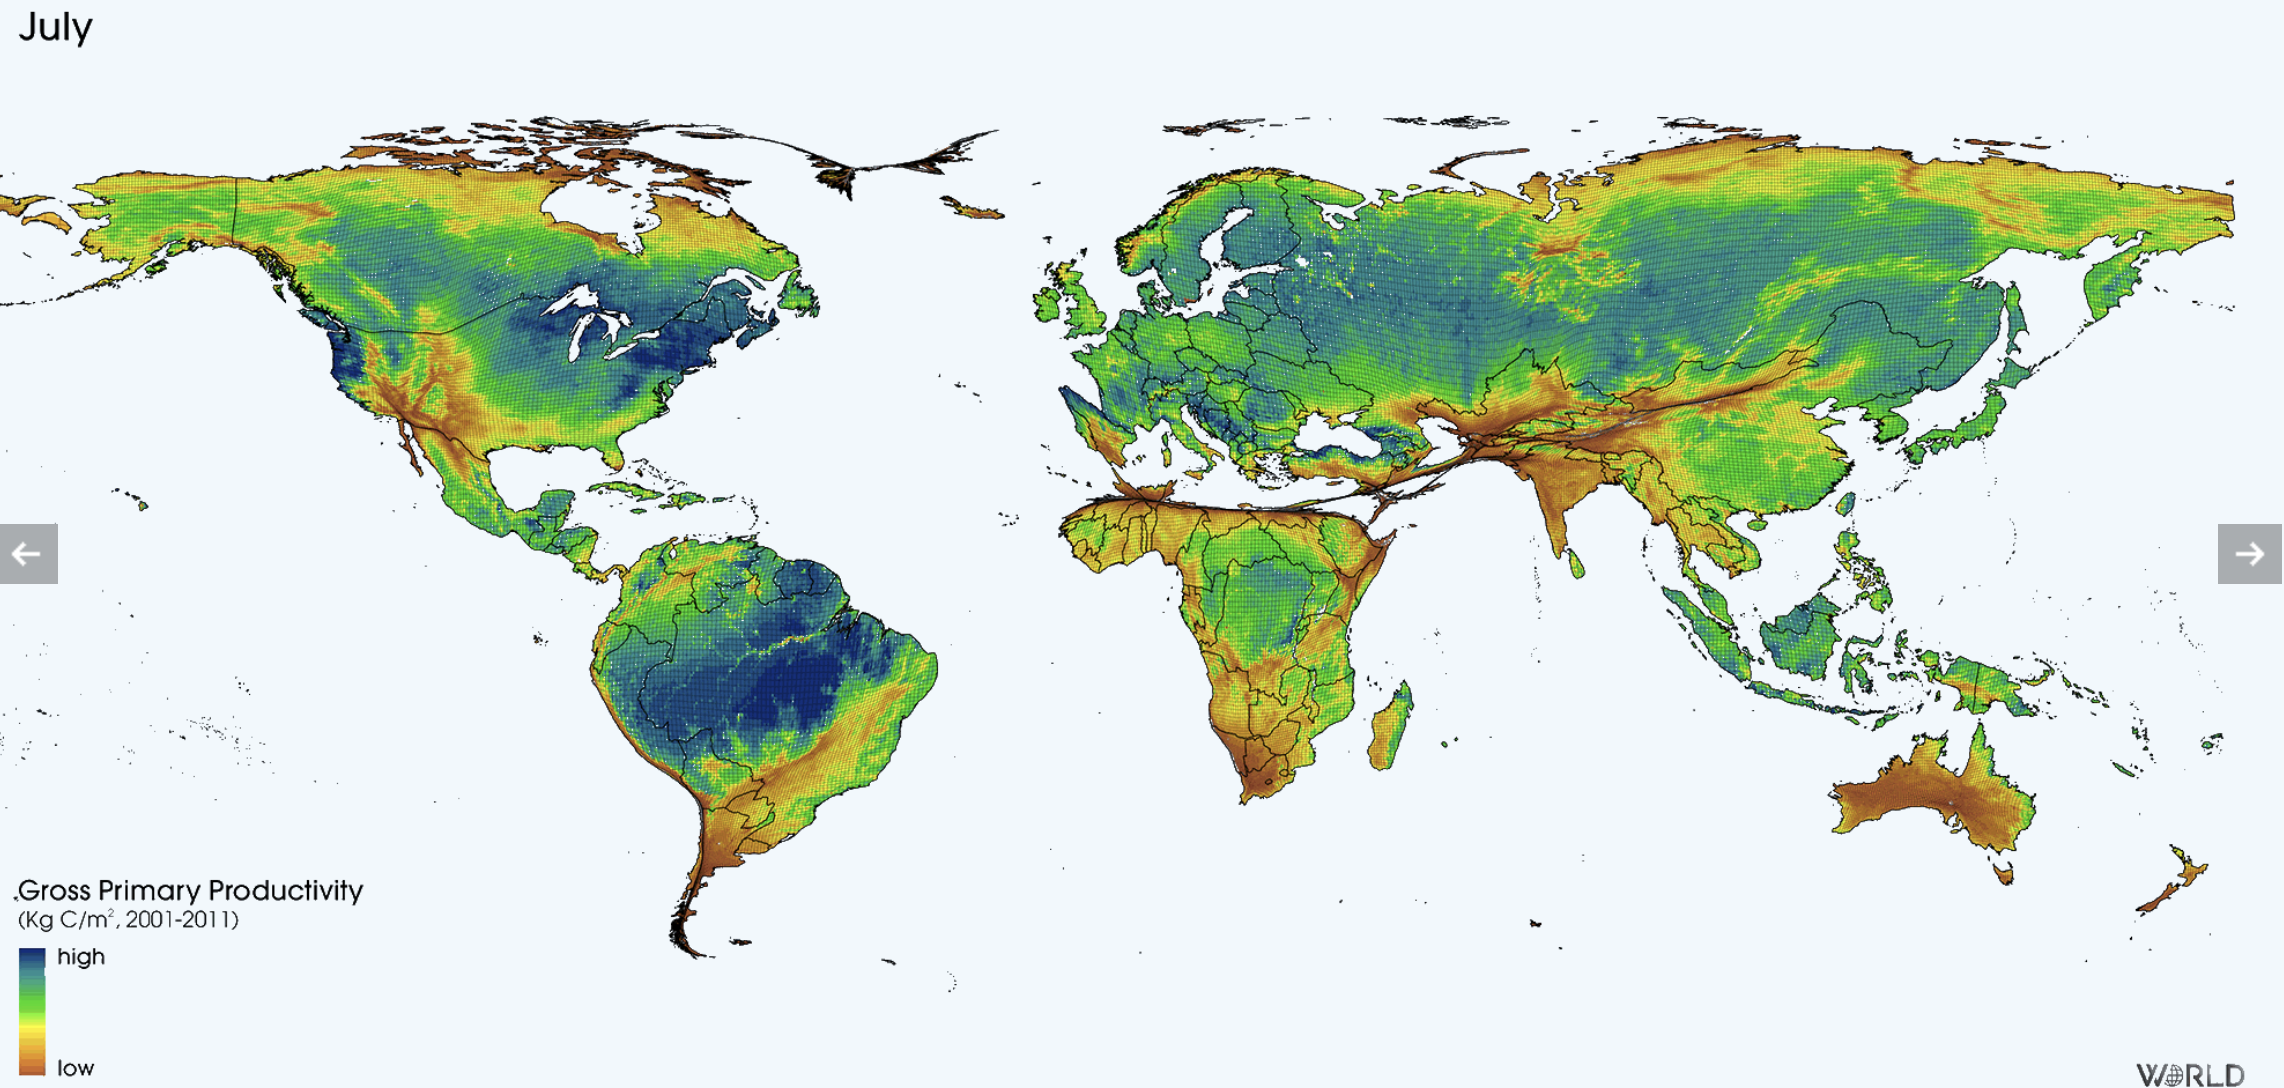
Particularly interesting, I think, is that not only are the tropical areas more productive than the higher latitudes but also their annual variation is relatively small compared with the higher latitudes. The more northerly parts of North America, Europe and Asia almost disappear in mid-winter. Its also interesting to see how much more productive Australias ecosystems are in summer, even though most of them are not that far from the equator (nearly all of mainland Australia is within 35o of the equator, whereas hardly any of Europe is closer than 35oN). New Zealands annual variation is even greater.
State of climate action globally
In readiness for last years COP meeting, the World Resources Institute assessed 42 indicators of progress towards keeping global warming under 1.5oC. Only one of the 42 was on track to meet its 2030 target: the share of EVs in passenger car sales. The recent increase suggests that EV sales have embarked on the s-shaped curve that is characteristic of a successful behaviour change.
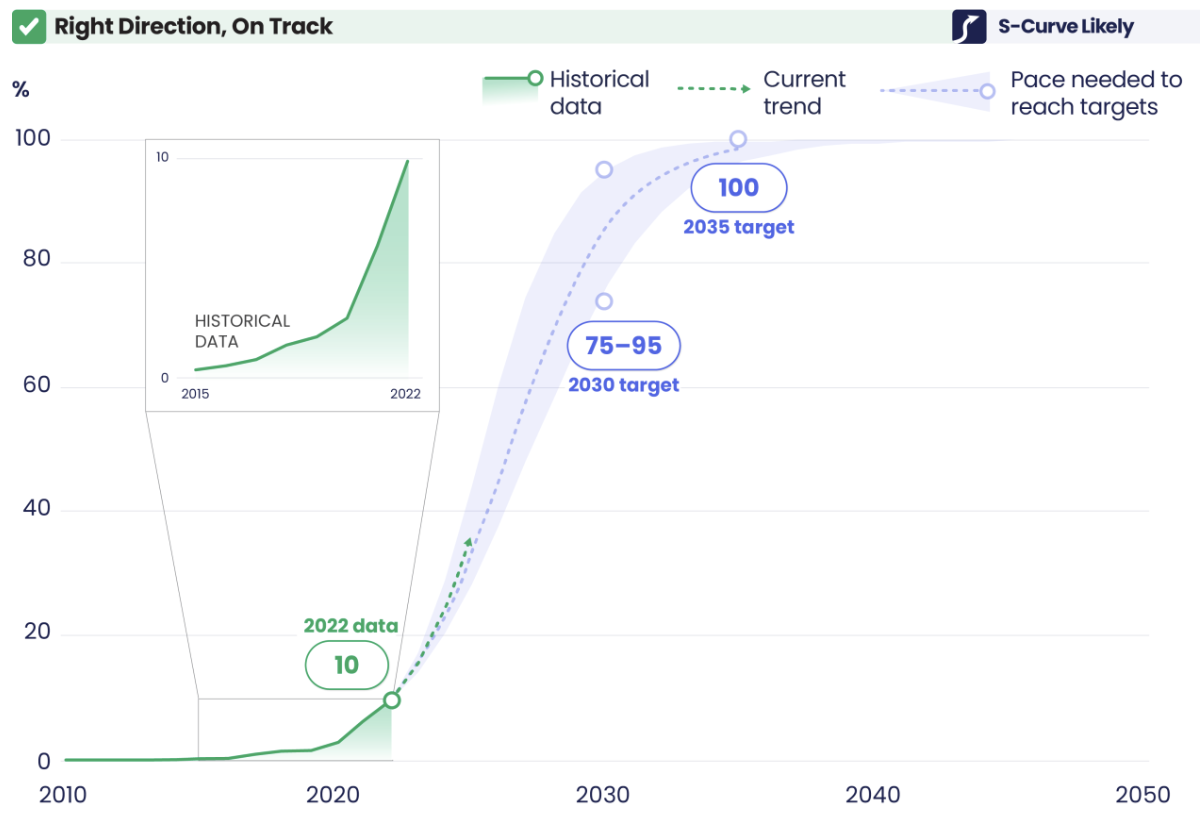
Thanks to China for this singular success. As well as dominating the supply of EVs, China also leads on sales. In 2023 6.7 million EVs were bought in China, representing approximately 30% of car sales within the country and over 50% of global EV sales. Europe comes second with approximately 25% of global sales.
Of the other 41 indicators, 30 were heading in the right direction but far too slowly, 6 were going in the wrong direction and there was insufficient data to evaluate 5. For instance:
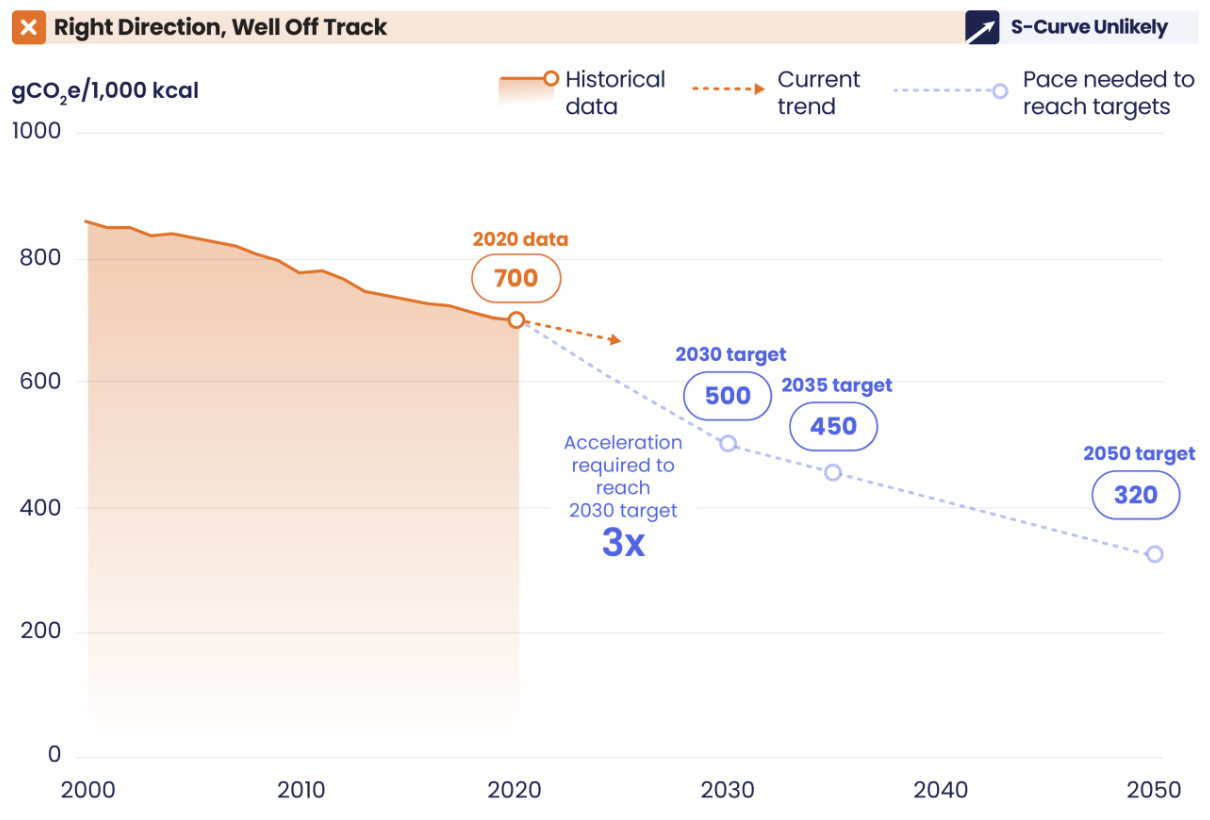
The agricultural sector contributes about 10% of greenhouse gas emissions (GHG) and there is considerable potential to reduce this. Reduction is happening but needs to be three times faster to meet the 2030 target. The graph below shows the past, projected (trend) and required GHGs per 1,000 kilocalories produced on farms. (1,000kcal is what most of us would consume in about 15-18 months and I must confess that Im surprised to see that produces only 700gm of GHG tell me if Ive got something wrong.)
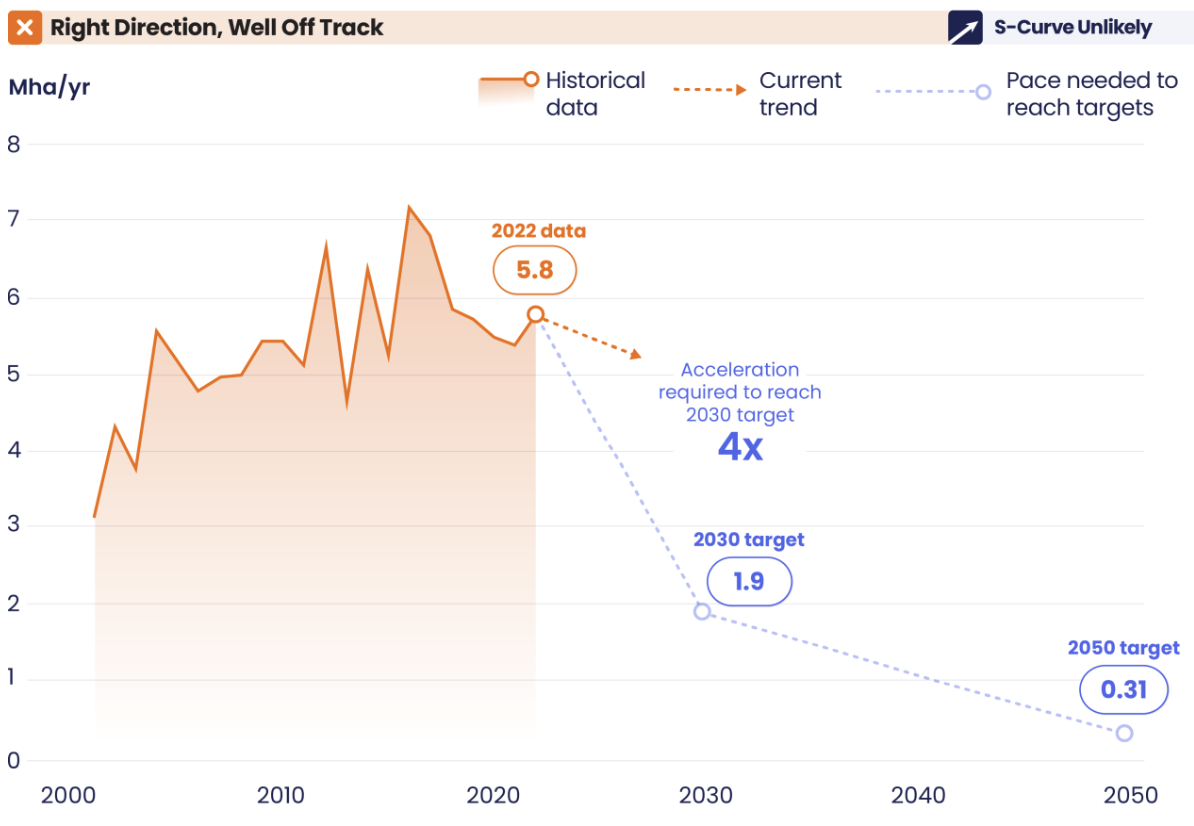
Second, reducing deforestation is critical for both controlling climate change and halting the loss of biodiversity. Again, were way off track. The graph below displays the millions of hectares of forest destroyed each year. The conclusion that deforestation is decreasing and just needs to be four times quicker looks optimistic to me.
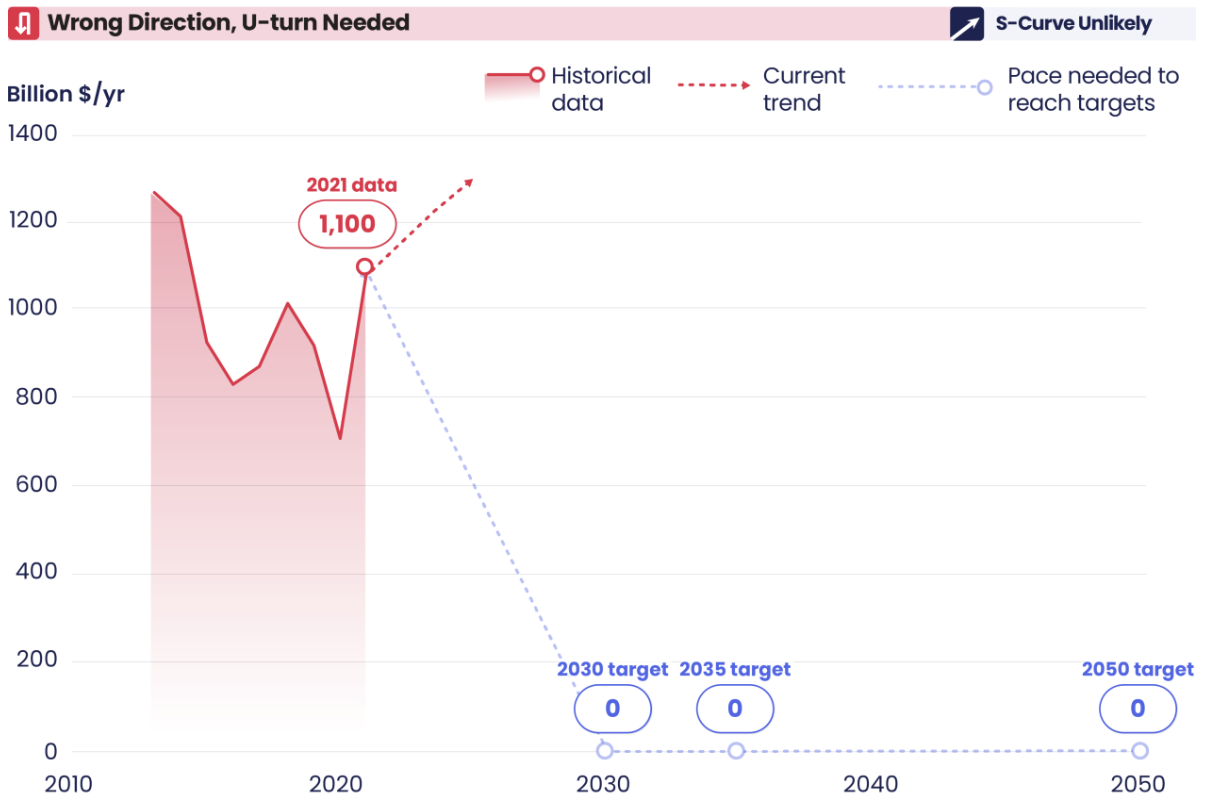
Finally, everyone agrees that public subsidies for fossil fuel activities need to be phased out rapidly. Well, everyone except the companies and the governments of countries that produce or import a lot of fossil fuels. As the next graph of total public funding for fossil fuels demonstrates, the shareholders are the ones with smiles on their faces at present.
They supported transitioning away but are increasing production
At the end of the last COP meeting, the participants agreed to call on Parties (i.e. countries) to contribute to transitioning away from fossil fuels in energy systems, in a just, orderly and equitable manner.
The decision has stimulated much debate, largely focused on the exact choice of words (for instance, the weak verb calls on means pretty please, if you feel like it) and the qualifications and loopholes. The thousands of words written can be reduced to two simple positions: (1) its the beginning of the end for the extraction and burning of fossil fuels, and (2) the compromise agreement is purely ornamental.
The hypocrisy of some of the nations that strongly supported the decision is evident from the figure below that shows the planned change in total fossil fuel production of nineteen large producers between 2021 and 2030. The red bars represent strong supporters of the decision, five of which are planning to increase their production. But even the ones with plans to decrease production will still be producing plenty.
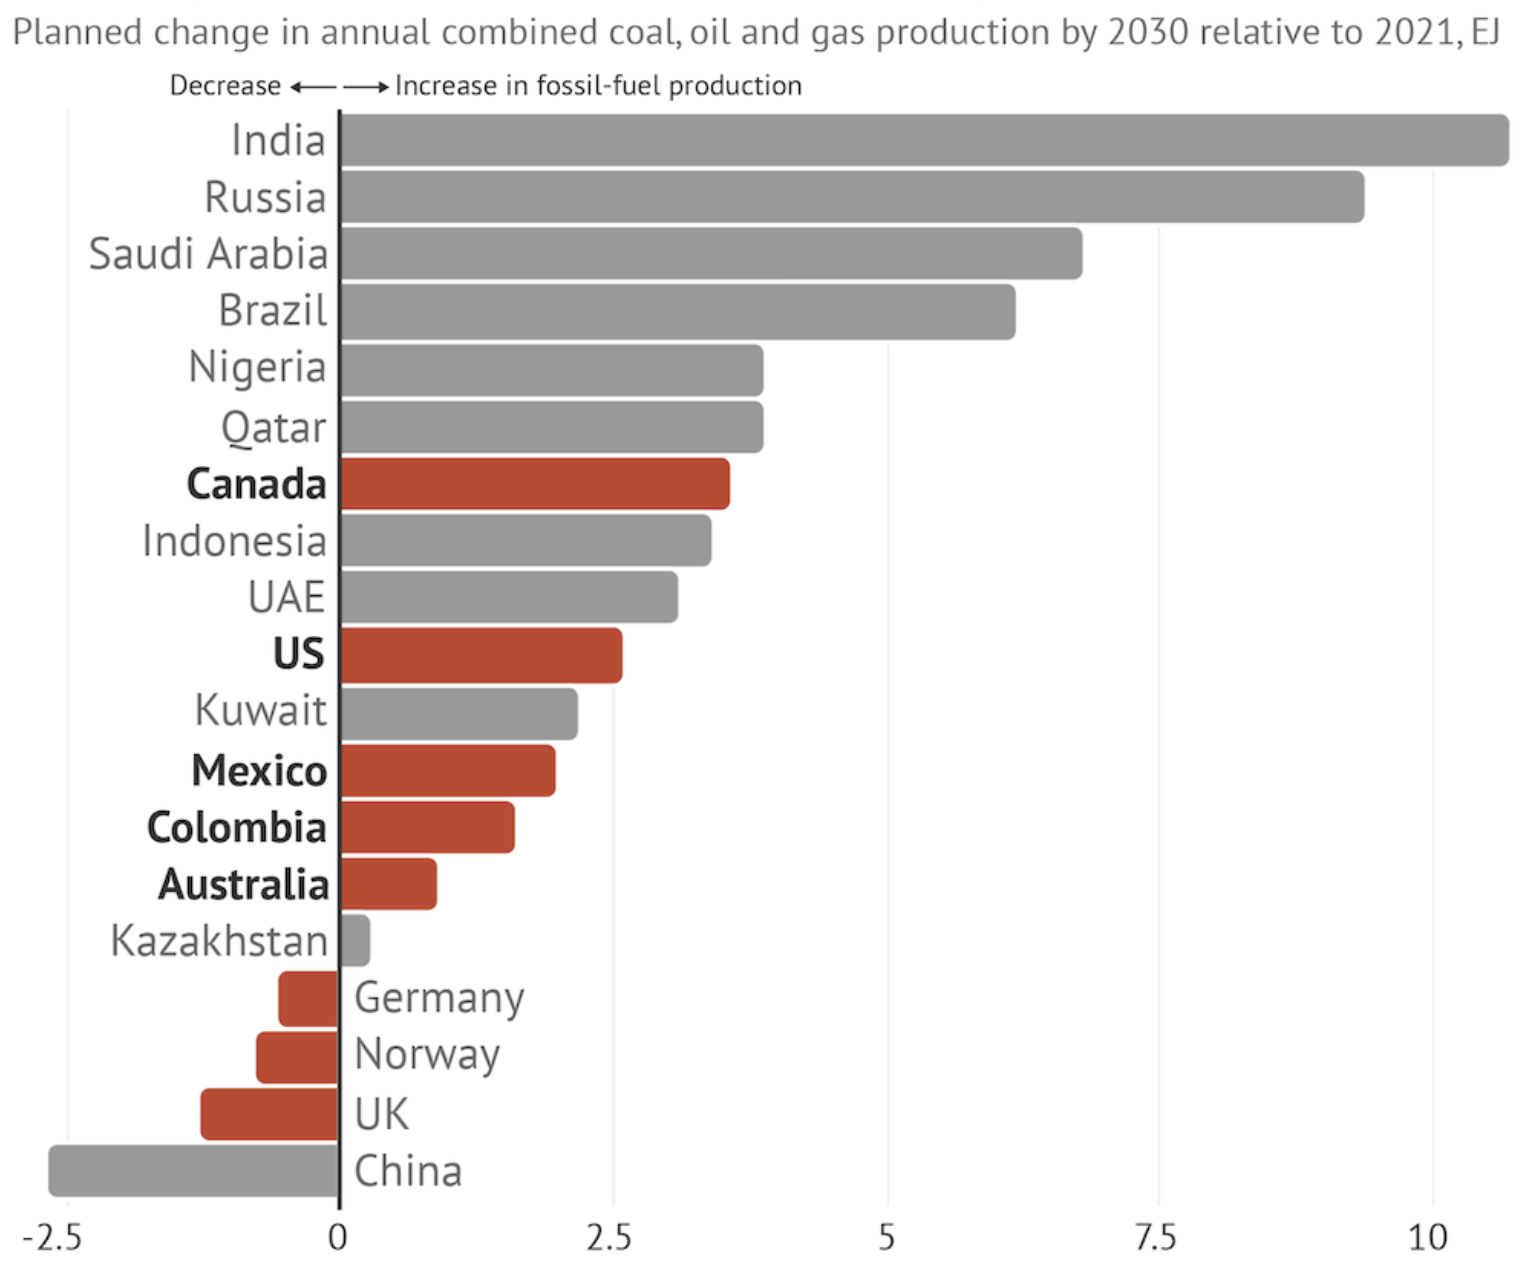
Poor developing nations (e.g. India, Nigeria, Indonesia) make the reasonable point that their economic and social development is currently heavily dependent on the production and/or consumption of fossil fuels and that to deprive them of this will condemn them to ongoing underdevelopment and poverty. On the other hand, developed nations such as Canada, USA, Australia, Germany, Norway and UK are rich enough to manage the economic and social transition that will accompany a rapid reduction of their production and/or consumption. In the middle is a group of nations that are still developing but are far from poor (e.g., Saudi Arabia, UAE, Qatar, possibly China) and could also afford to make the transition.
Pangoquiz
I suspect that many readers know that pangolins are the only mammal that is covered with scales and that because of the alleged medicinal properties of those scales they are the most illegally trafficked mammal (mostly dead). See how much else you know about pangolins with this five-item quiz.