Environment: Rich people are melting Arctic sea ice
April 15, 2023
Rich countries and rich people have incredibly high greenhouse gas emissions. Arctic sea ice is shrinking. Tasmanian government plans to make fish farms more environmentally destructive.
High income = High emissions
Ive previously discussed how wealthy countries are responsible for a disproportionately huge share of greenhouse gas emission and how rich people, wherever they live, have much higher personal emissions than the rest. The figure below brings these two separate but related issues together.
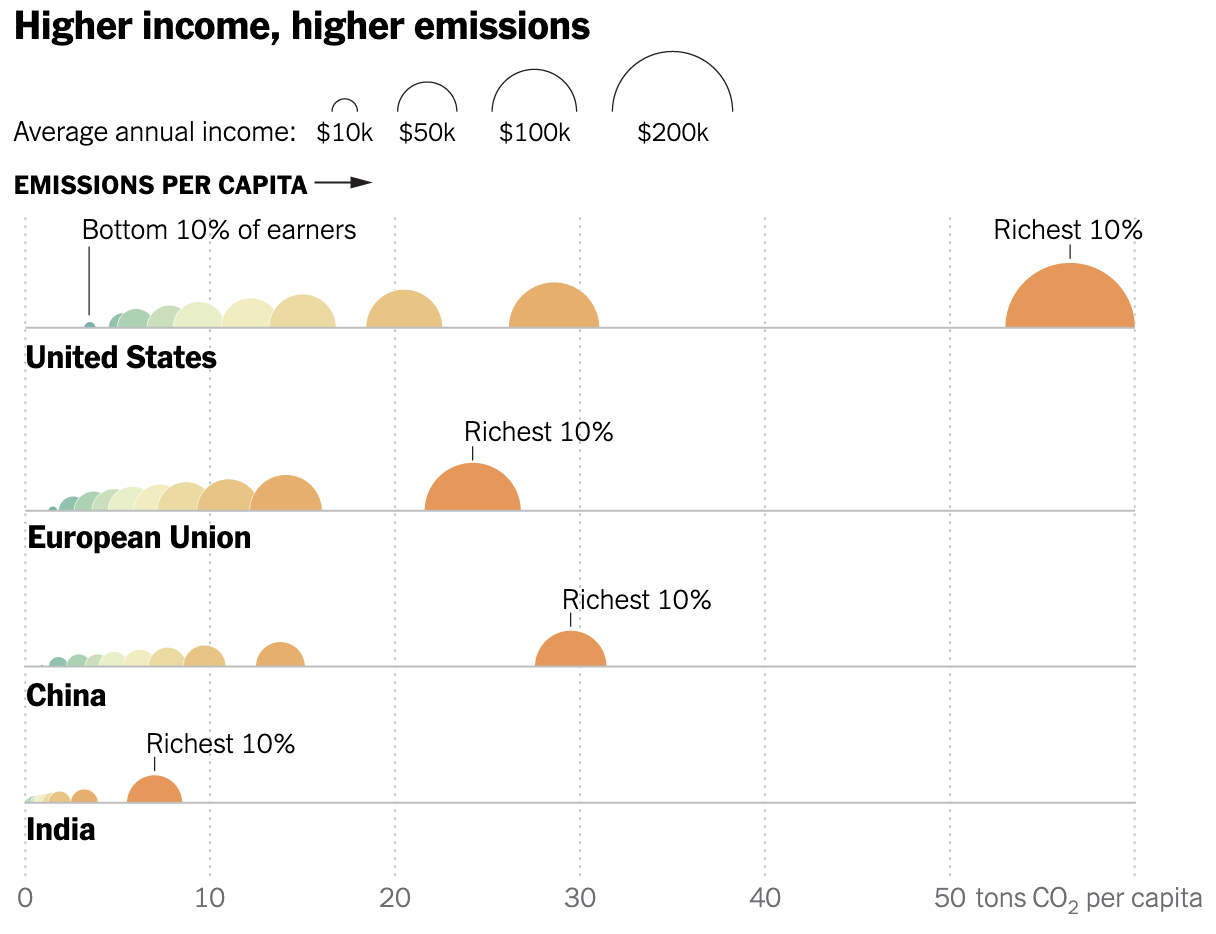
The USA stands out in every regard. It has the highest average emissions per capita and the greatest range of emissions per capita between the poorest 10% and the richest 10%. Additionally, the emissions per person of its richest decile are way ahead of the emissions of other countries richest deciles. This, no doubt, is because the USAs richest decile is much richer on average (average income US$234,000/year) than the other countries richest deciles much richer even than its own second richest decile.
India is the poorest country shown and the one with the lowest average emissions per person, but even in India emissions per person clearly increase with wealth, although their richest deciles emissions would be in the middle of the other countries ranges. The USAs poorest 10% has higher emissions per person than all of India except for the richest 10%.
The message is clear, to reduce total emissions we have to seriously reduce the emissions of rich countries, particularly their very richest people, but also middle and high income people in middle and high income countries. In fact, if we take the emission of 2-3 tons of CO2 per person per year to be a sustainable level, the vast majority of people in all but the very poorest countries will have to reduce their emissions, some much more than others.
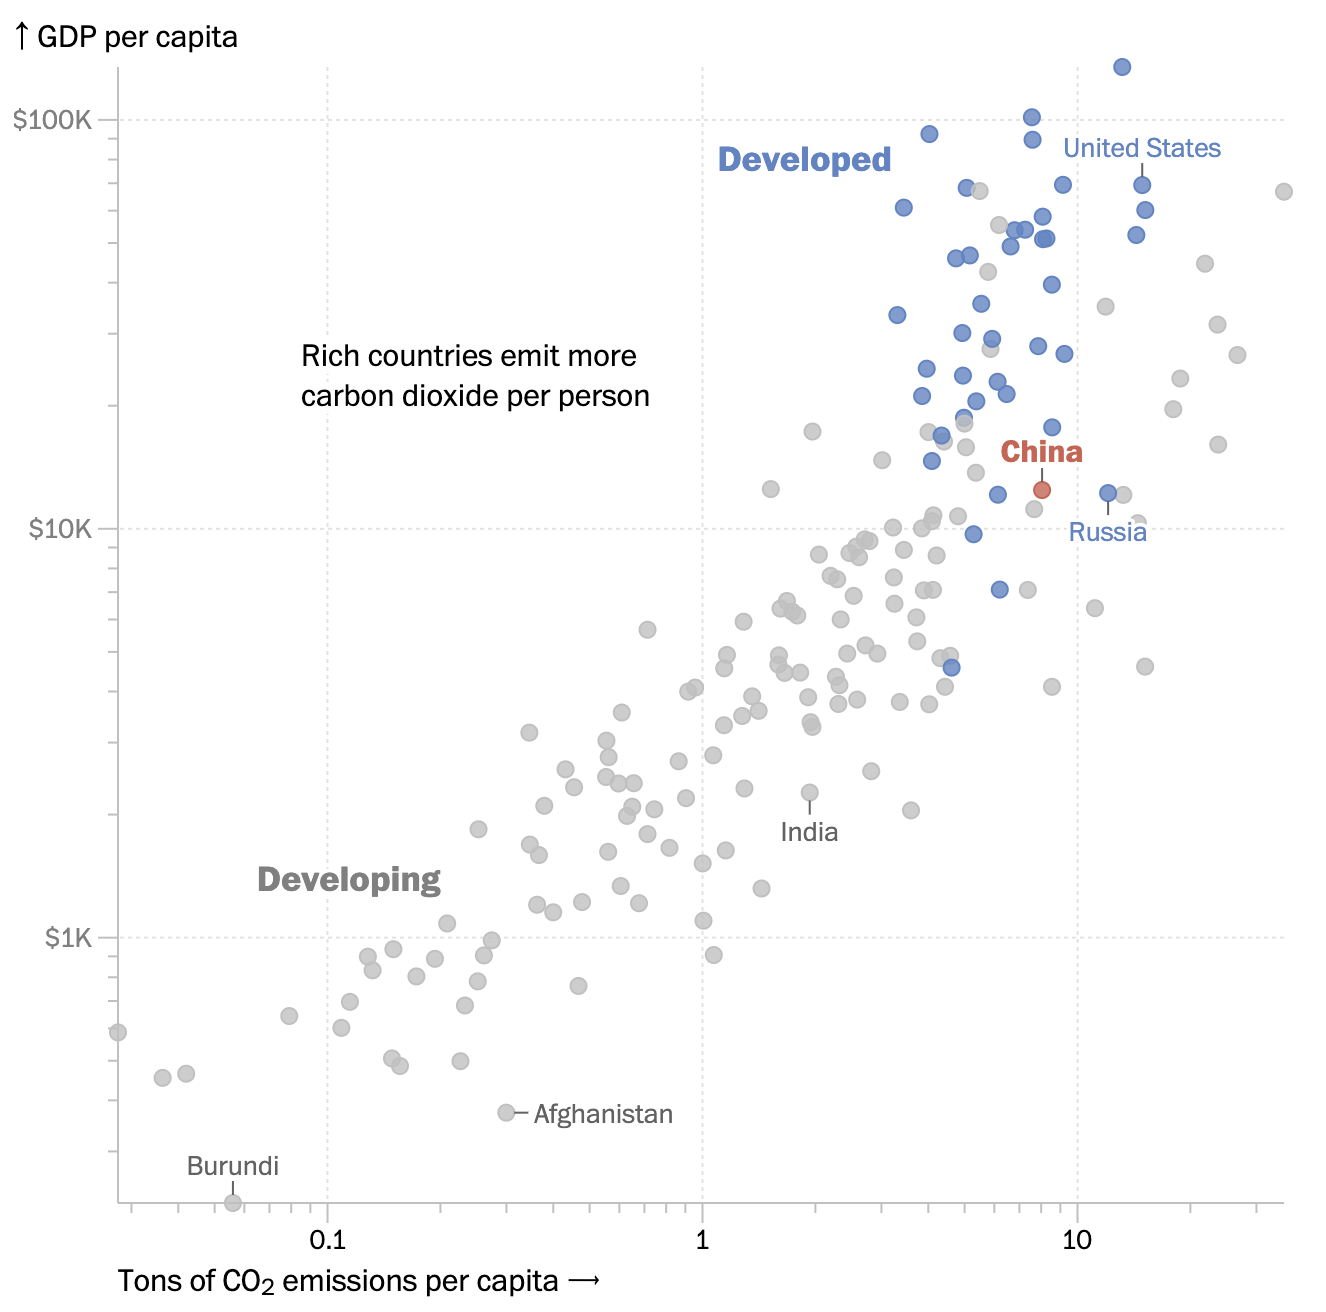
The association between a countrys GDP per person and CO2 emissions per person stands out like a sore thumb in the next graph. Australia is the blue dot immediately below the USA. In 2021 we had a population of 25.8 million, CO2 emissions per person of 15.2 tons and GDP per person of US$60,190. The figures for Niger and Madagascar, with very similar population sizes to us, were 0.1 tons and US$500-600 per person. If you go to the hyperlink, you can hover over the graph to explore the details for each of the countries.
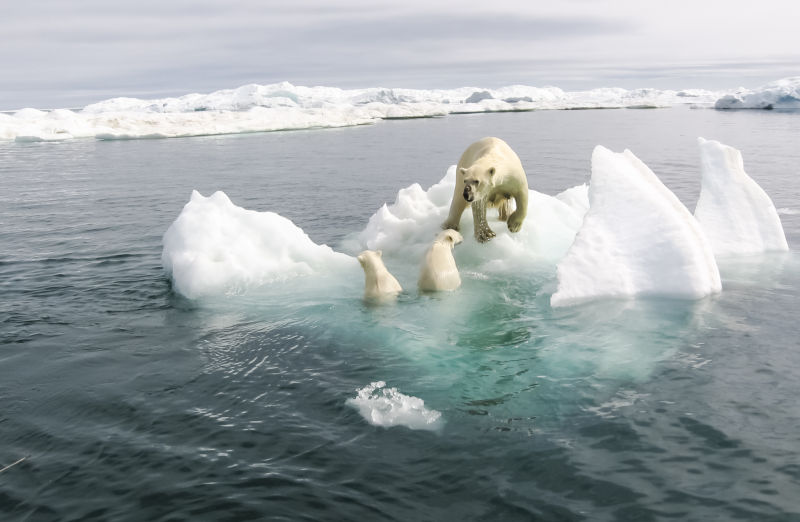
Disappearing Arctic sea ice
The graphs below displays for each year between 1979 and 2021 the extent of Arctic sea ice in March (the month when it is most extensive) and September (when it is least) compared with the average extent of the sea ice in those months during the reference period 1991-2020. The percentage variation from the average is the anomaly - blue indicates more ice than average, red less.
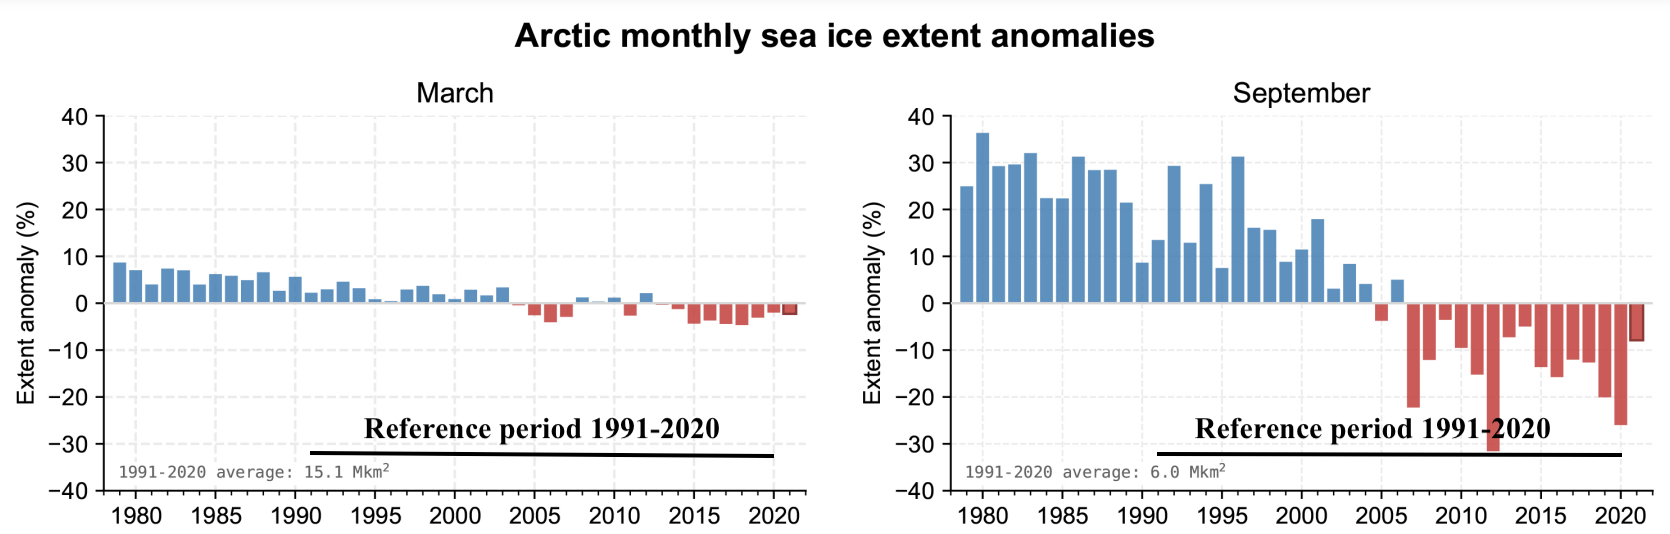
It is clear that in September for every year between 2007 and 2021 the extent of the sea ice has been below the average. Looking further back, though, the extent has been steadily decreasing since the 1990s. In fact, since 1980 the extent of the sea ice in September has decreased by 13% per decade. The decrease in the area covered by thicker, multiyear sea ice (rather than first year sea ice) has been particularly marked and over the last ten years multiyear ice has constituted only 23% of the September total compared with 35% in the 1980s.
Because the reduction in the extent of the sea ice has been much less in March than September, the September average has gone from half of the March average in the 1980s to a third in the last decade.
Sea ice at both poles is an important influence on weather and climate systems The extent of sea ice is influenced by the temperature of the surrounding air and water, and by winds and ocean currents. At the same time, the sea ice itself influences the temperature of the air and water around it and the amount of energy absorbed from the suns rays. Its all part of a complex system of feedback loops that partly explain why the global warming being experienced in the Arctic is higher than the global average. This Arctic amplification is expected to increase in the coming years.
In the Antarctic, the summer shrinkage of the sea ice is much less marked and there is more year to year variation. Graphs for the Antarctic can be found in the hyperlink above.
Kentucky is mining less of TEFs number nine coal

Kentucky generates the least amount of wind and solar energy (almost none) of all 50 US states and recently legislated to prevent the closure of several fifty year old, uneconomical, privately owned coal-fired power plants.
Supporting the bill, on March 16th this year, Richard White, a Republican member of the Kentucky state legislature, argued for coal as one of Gods gifts to humanity: When God created this Earth, he provided us with natural resources and coal is one of them. [God intended coal for people] to make a living, to survive in this world.
I dont wish to offend any readers who have a religious faith but according to this logic one might just as well argue that Whites God created coal so that humans could burn it all and obliterate not only themselves but also many of his other creations.
Perhaps the seemingly failed project to create intelligent life will convince the ineffable being that he (Ill stay with Whites preferred pronoun for simplicity) should cut his losses, abandon humanity and start again. On the other hand, he might prefer to forget all about it and take it easy for the rest of eternity. That said, maybe he hasnt completely given up on humans yet. He seems to be helping Kentuckians reduce their dependency on number nine coal in 2022, coal production in the state was only a third of what it was in 2013.
Interestingly and in fairness to Mr White, coal does get a few mentions in English translations of the Bible but most seem to be either metaphorical or a reference to a glowing ember of wood rather than the black stuff that can be dug up and carried into parliament by duplicitous treasurers with cunning plans to become prime minister.
Tasmanian salmon farms to become dirtier
A few weeks ago I encouraged people to stop buying farmed Tasmanian salmon because of the associated environmental destruction. Well, whaddayaknow, the Tasmanian government is planning to wind back the already weak marine protections even further and make it easier for the farmers to pollute the waters and kill the wildlife.
The sea cages that house the growing salmon in Macquarie Harbour and around Bruny Island, for example, wash the waste from the farms into the surrounding ocean. Inland, the hatcheries for the young salmon pollute Tasmanias rivers. There are also welfare concerns for the salmon in overstocked farms and dangers for marine wildlife that get caught in gear, damaged by underwater explosions and shot with leaded bean bags. Scientists, policy experts and the community want stronger regulation of farm practices but thats not what the industry or the government are planning.
The governments draft new environmental standards:
- Ignore the issue of salmon escaping and damaging local ecosystems (although the local Tasmanians dont mind the resulting free feed);
- Fail to set limits on the number of salmon that can be farmed in the fragile coastal waters or on the release of pollutants such as nitrogen, phosphorous, antibiotics, food waste, faeces and industrial debris that damage the marine ecosystems;
- Do not require the public release of salmon farming monitoring data or decisions made by the Environmental Protection Agency.
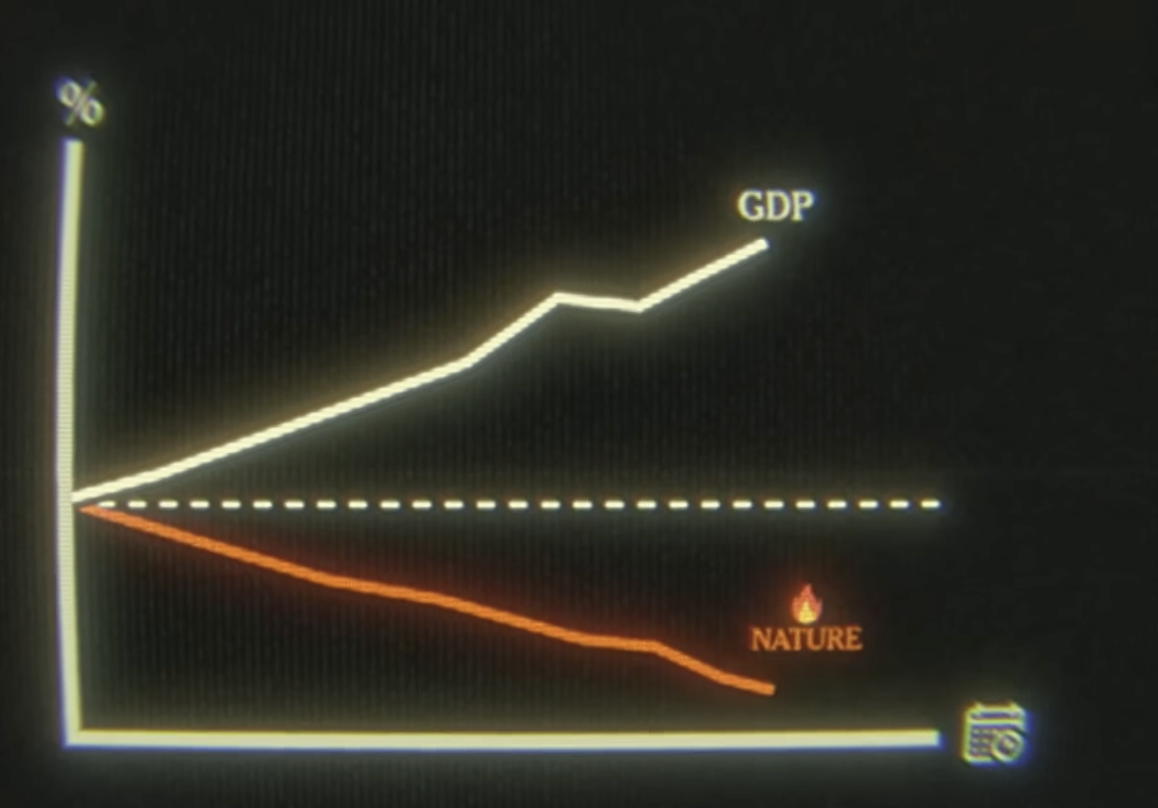
The most important person youve never heard of
Im not sure that youll learn a great deal about the relationship between GDP and environmental damage (see graph), or what we need to do about it (Pay for what we use is the summary), from this video about the work of Partha hes got the answer to everything Dasgupta, professor of economics at Cambridge University. But it is very amusing and his football team metaphor for the relationship between GDP and the environment is quite good. Its definitely worth 5 minutes of your time.