Environment: Sleepwalking into our fiery future
August 27, 2023
Not enough action to preserve our forests and not enough action to prevent bushfires. Less than twelve years before we hit 1.5o of global warming.
Bushfires – how many warnings do we need?
The fires in Hawaii have prompted David Bowman, Professor of Pyrogeography and Fire Science at the University of Tasmania, to revisit the situation in Australia. Comparing the period 2002-2018 with 1988-2001, the average area burnt each year increased 3.5-fold. If the Black Summer fires of 2019 are included, the increase is 8-fold. Apart from the lightening and human activities that start fires, the underlying causes of the increase are all related to global warming: low rainfall causing extended droughts, dry vegetation and low humidity; longer fire seasons; strong winds; and extreme temperatures.
Bowman was supportive of the findings and recommendations in the bushfire royal commission’s report in late 2020. Three years on, he laments the failure to implement the changes needed: an integrated approach to fire prevention, better use of Indigenous knowledge and expertise, early warning systems, improvements to urban planning and building standards, better management of fuel loads in forests, increased firefighting capacity, and better preparation for bushfires. Not forgetting rapid reductions in greenhouse gas emissions, although the benefits of this will not be seen in the near future.
David Lindenmayer and colleagues have examined the frequency of forest fires in six bioregions of Victoria between 1981 and 2020. Between 1981 and 2000, 667,000 hectares of forest were burnt, approximately 5% of which burnt more than once. Between 2001 and 2020, 3.1 million hectares burnt, a third of which burnt more than once. Some areas experienced four fires in 25 years. (Areas that had had hazard reduction burns were excluded, as were areas that had been logged because regenerated forests are known to be at high risk of severe burns for up to 70 years after harvesting.)
In all six bioregions, there were more fires in the second 20-year period. Land elevation showed the most consistent relationship with fire frequency: the highland areas of the Snowy Mountains, East Victorian Alps and South East Coast Ranges experienced the greatest increase. The relationship between fire frequency and rainfall, temperature, and the slope and direction of the land varied considerably across the bioregions.
The authors emphasise the risk of an increase in fire frequency degrading forests and causing loss of biodiversity and even ecosystem collapse. They highlight the need to reduce flammability by limiting logging and avoiding hazard reduction burns in areas where they may make the forest more rather than less flammable. They also stress the need to use new technologies for the early detection and better management of wildfires.
Bowman sums up the situation with blunt clarity: _‘_When will Australians – who live on one of the most fire-prone continents on Earth – get a grip on this escalating global problem? How many more warning signs do we need? We’re behaving as if we’ve got an endless amount of time. Australia is sleepwalking into our fiery future.’
Australia’s trees scorecard
It isn’t well appreciated that eastern Australia is a global hotspot for deforestation (we are the only developed nation to achieve this status), principally because governments have failed over many years to halt land clearing and native forest logging. Australia-wide, 50 million native trees are lost each year to deforestation, disrupting the connection between Country and Indigenous Australians, and causing the death of over 70 million mammals, birds and reptiles. And who knows how many amphibians, fish and invertebrates.
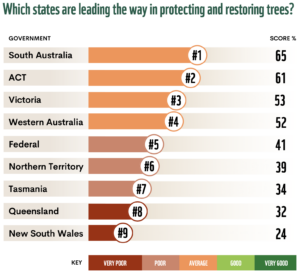
WWF-Australia has evaluated the performance of all Australian governments on eleven indicators of leadership in tree protection and restoration that would shift Australia ‘from a deforestation hotspot to a reforestation nation’. The indicators cover the amount of forest and woodland currently intact, three significant causes of tree loss, and seven measures of government response to the problem.
The Trees Scorecard does not make pretty reading: no government received a ‘Good’ or ‘Very good’ score. South Australia and the ACT were closest to the top of the tree with scores over 60%, while NSW (24%), Queensland (32%) and the Northern Territory (34%) were scratching around in the leaf litter. NSW failed to score over 50% on any criterion.
Any state wanting to improve their performance simply has to look at the scorecard’s ‘government response’ criteria. In a nutshell: end native forest logging; strengthen laws to reduce land clearing; close loopholes and reduce exemptions to laws; improve compliance with the laws and increase penalties for transgressions; improve measurement and monitoring and make the results publicly available in a timely fashion; and engage more with Traditional Owners.
Gum trees of WA
I spent last week on several of Bush Heritage’s conservation reserves in Western Australia, three in the Fitz-Sterling region in the south-west corner and the Charles Darwin Reserve on the northern edge of the WA wheat belt, a 4-5 hour drive north-east of Perth.
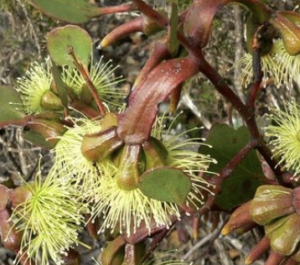
Who knew there was a tree delightfully called a Platypus Gum (Eucalyptus platypus) growing in south-western WA. It acquired its name because the stalk that links the flower to the stem resembles a platypus’s bill – i.e. it is broad, flat and ‘foot’ shaped. This is visible with the eye of faith in the photograph below but the ones I saw were rather more platypus bill-like.
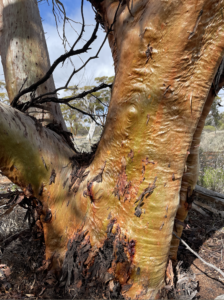
On the Charles Darwin Reserve there are stands of beautiful Gimlet Gums, more formally referred to as Eucalyptus salubris because of tree’s healthy appearance.
WA’s Tree Score of 52% is more than double that of NSW but it has no room for complacency. On the credit side, WA has committed to phasing out native forest logging in the south-west of the state by 2024 but it scored very poorly on land clearing because it has a poor regulatory framework and weak monitoring and enforcement, and dreadfully on the transparency of the data that is available.
Metaphors for life
Seven centuries ago, John Donne almost said ‘No animal is an island entire of itself; every animal is a piece of the continent, a part of the main’.
More recently, Jason Bittel has expressed a similar sentiment, also with a geographic metaphor, ‘Think of every species as a pebble tossed into a lake. Everything a species does—what it eats, where it lives, how much it poops—radiates outward, eventually merging with the ripples of everything else living in its ecosystem.’
Citing a recent study, Bittel goes on to emphasise that many large-bodied mammals, both herbivores and carnivores, create tidal waves rather than ripples in their ecosystems because of their direct and indirect roles as landscape engineers. Unfortunately, as a result of habitat loss, hunting and now climate change, many such mammals have suffered severe reductions in their numbers, with serious consequences for their ecosystems.
Re-establishing or increasing the diminished numbers of twenty large mammals in their natural landscapes could not only restore ecosystems but also help us reach our climate goals. The reintroduction of wolves into Yellowstone National Park is probably the best-known example of such a rewilding project. Similar initiatives involving, for example, brown bears and bison in North America, beavers and reindeer in Europe, and gazelle and hippopotamuses in Africa have the potential to restore ecosystems to something approaching their earlier condition.
When will we hit 1.5?
It seems highly likely that global warming will reach if not exceed 1.5oC compared with pre-industrial times for at least one year in the very near future. However, that does not mean that the aspirational Paris Agreement goal of keeping warming to no more than 1.5oC will have been missed. The Paris goal is based on the average over 30 years, not just one or even two years.
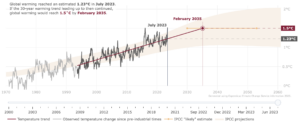
The last estimate produced by the Intergovernmental Panel on Climate Change (IPCC) was that the 30-year average would breach 1.5oC somewhere between 2035 and the mid 2050s. However, more recent data (graph above) indicates that if the trend of the last 30 years continues – and there’s little reason to believe that it will be any slower over the next decade – the 30-year average will hit 1.5oC at the very beginning of the IPCC’s estimate, in February 2035. This is similar to other findings that the anticipated consequences of global warming are occurring at the early end of previous predictions, or even sooner
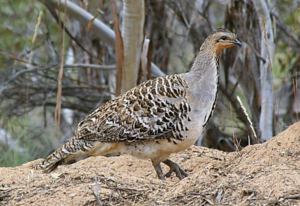
Male mallee sticky beaks
At the Charles Darwin Reserve, I was delighted to see a Malleefowl, a colourful, ground-dwelling bird, the size of a large chicken. Malleefowl incubate their eggs in large mounds consisting of earth and leaf litter which generates heat as it decomposes. The male bird senses the temperature inside the mound with his beak and makes any necessary adjustments to the arrangement of the decomposing organic material to keep the temperature at about 33oC. Malleefowl are listed as ‘Vulnerable’ nationally as a result of habitat loss and predation by feral cats and foxes.