Environment: Wealthy are the major CO2 emitters
March 12, 2022
Victoria turns a blind eye to illegal logging while USA maps protected areas. Rich individuals and nations need to reduce their emissions and eliminate global poverty.
Logging Victorias forests
Over the last year Ive covered stories about logging, legal and illegal, in South America, south-east Asia, central Africa and Europe. Heres a story about illegal logging in Victorias central highlands. Its a long and somewhat complicated tale legal and technical issues involving coupes, slopes, percentages and pixels, and several different branches of the Victorian government but the authors have done a good job telling it coherently. Fundamentally, VicForests is the state-owned company that harvests and sells timber from the states publicly owned forests. Its supposed to make a profit but survives on government subsidies. The Office of the Conservation Regulator (OCR) is the branch of the Victorian Department of Land, Water and Planning with responsibility for enforcing Victorias logging laws.
Professor David Lindenmayer and Dr Chris Taylor have produced evidence (based on VicForests own data) that VicForests has been logging where it is not allowed to log and that the OCR has taken little if any action when breaches of the legislation have been brought to their attention. Tell us what you think about this, David:
The whole thing is now a charade.
You would have to describe VicForests as an outlaw organisation.
VicForests would not be able to survive without continuing to log illegally and continuing to log important areas for biodiversity (and for Melbournes water supply).
Its bordering on corruption from the agency that is meant to be doing the regulation.
Still, Victorias Environment Minister, Lily DAmbrosio, is on the case. First, she commissioned an independent review of the OCRs investigations and said that the OCR operated within the regulatory framework, even though the report concluded that the OCR did not demonstrate a strong, strategic, preventative and intelligence-led approach. Second, shes changed to the law to allow previous limits to be breached, although even that would not render some of the previous breaches by VicForests legal.
Mapping ecological threats and protection
The red areas in the map below are the places in the USA containing plants and animals at highest risk of global extinction. Not just the flora and fauna of the land but also of the rivers, streams and lakes. Iconic species such as gray wolves and brown bears are not included because they arent globally threatened. The green on the map shows areas permanently protected for biodiversity. Its obvious that most of the red at risk areas are outside the green protected areas. Perhaps not surprisingly bearing in mind its enormous economy and traditionally politically progressive population, California is the state with the most red and the most green.
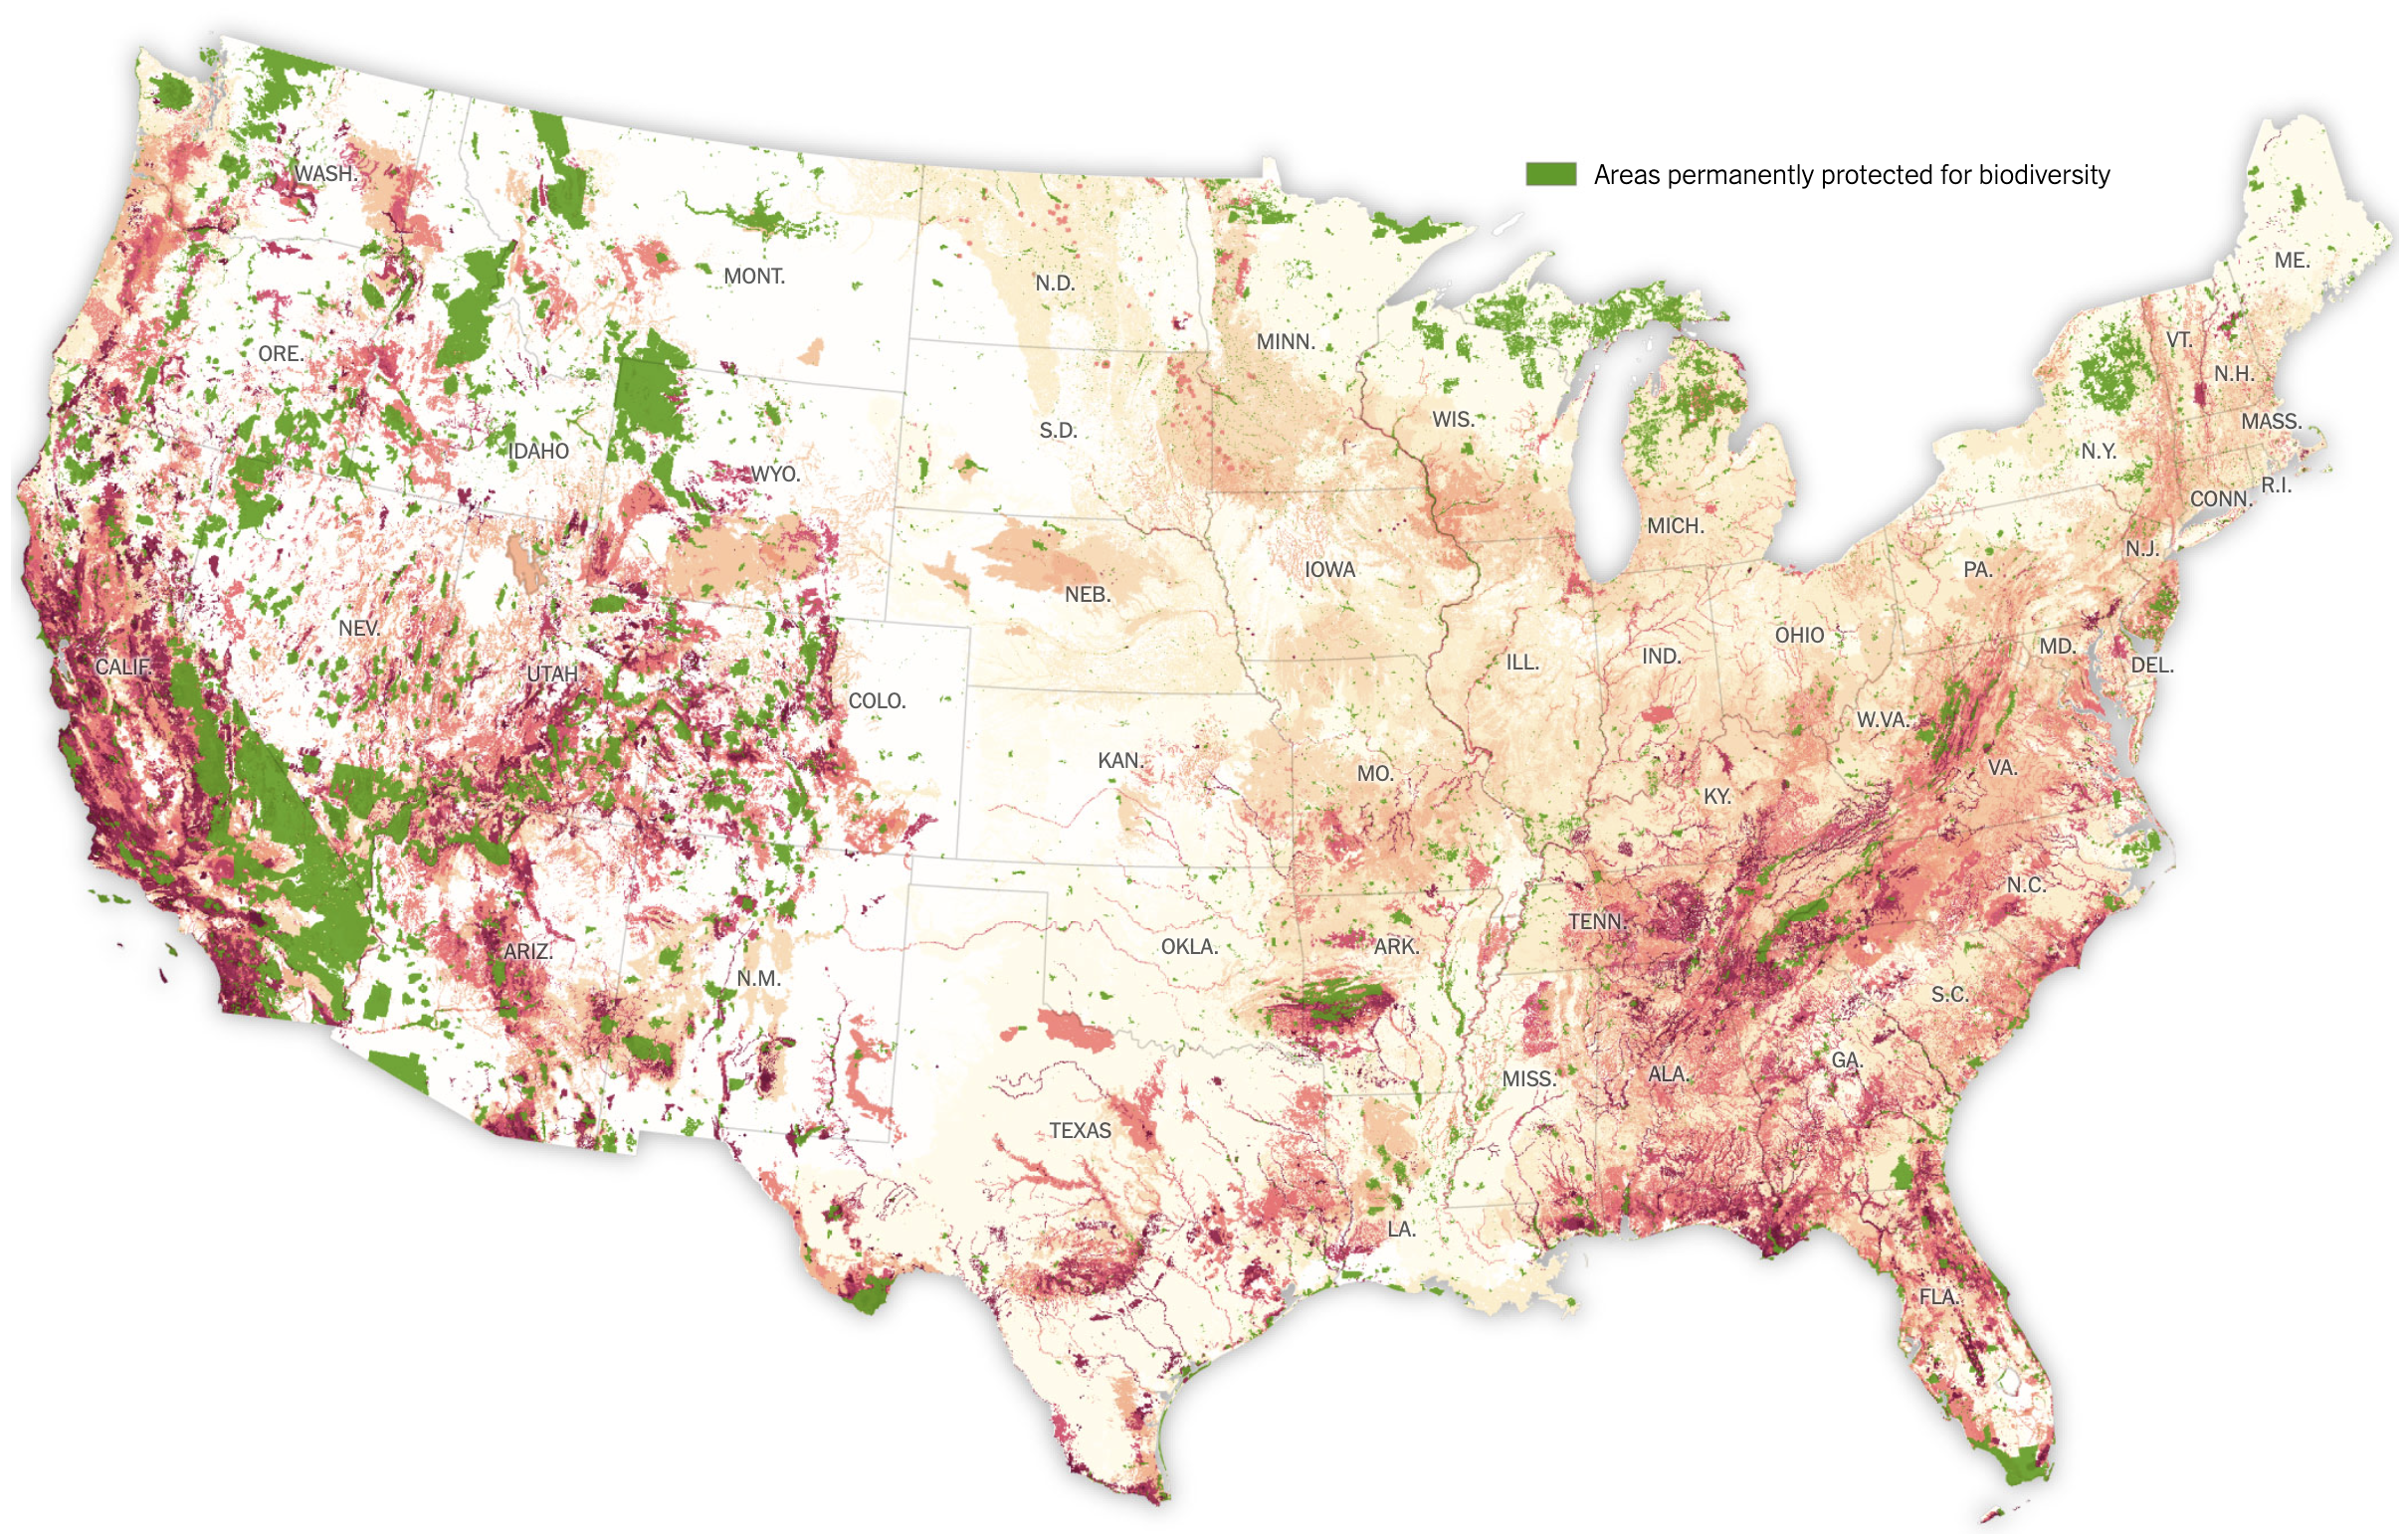
The protected areas currently occupy 13 per cent of the USA. The Biden administration has a goal to reach 30 per cent by 2030 in line with the global 30x30 proposal for land and water conservation. Just ensuring that 30 per cent of the country is protected is not much use though if many of the protected areas contain few if any threatened species or little biodiversity.
Mapping areas containing globally at risk species and protected areas provides policy makers with information about the best areas to protect either because they are biologically valuable or because they provide a corridor between important areas. About 70 per cent of the red areas in the map are on privately owned land. Detailed mapping also allows landowners, conservation groups and government (for instance with tax incentives) to work together to prevent extinctions. Its also important not to forget the areas that dont contain many at risk species. They soon will if habitat loss and destruction within them continues.
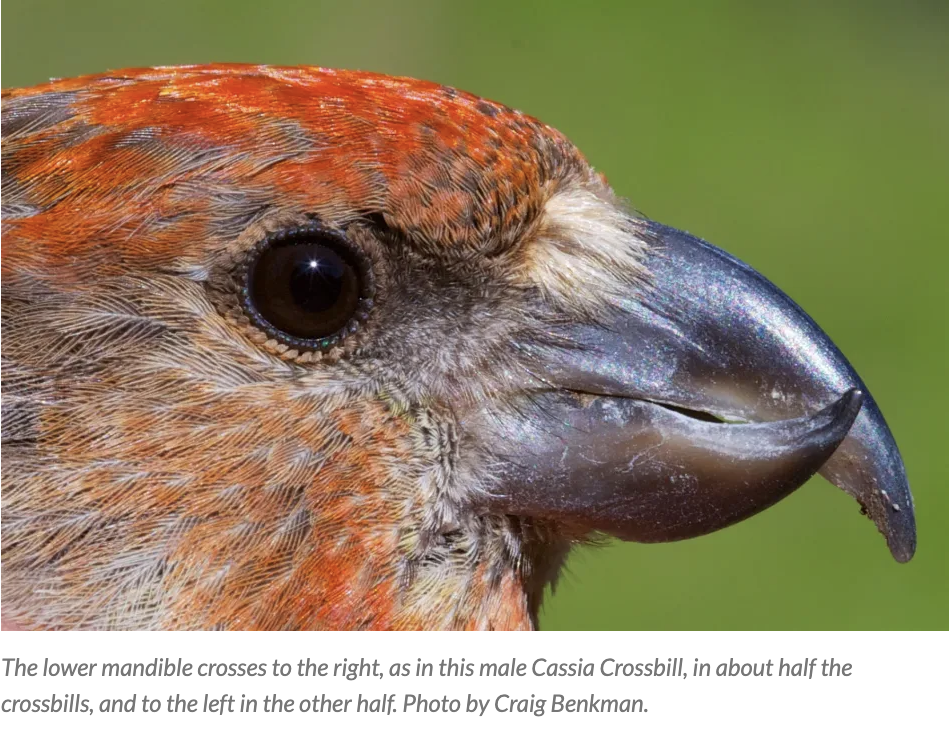
The threatened Cassia Crossbill, featured in the linked article above, is found in just one county in Idaho.
Wealth and CO2 emissions
Two significant international agreements were made in 2015. The UN established the Sustainable Development Goals (SDGs). SDG1 includes eliminating extreme poverty and halving all poverty by 2030. Second, as we well know, by signing the Paris Agreement countries committed to keeping global warming well below 2 degrees Centigrade. So, big questions: 1) will poverty alleviation conflict with climate change mitigation, and 2) can we lift millions of people out of poverty while keeping carbon emissions under control? Bottom line yes, it is possible to lift more than one billion people out of poverty (mainly in Asia and sub-Saharan Africa) while increasing global carbon emissions by less than 2 per cent. But to keep global warming under 2 degrees C, high-emitting countries and individuals need to reduce their emissions substantially.
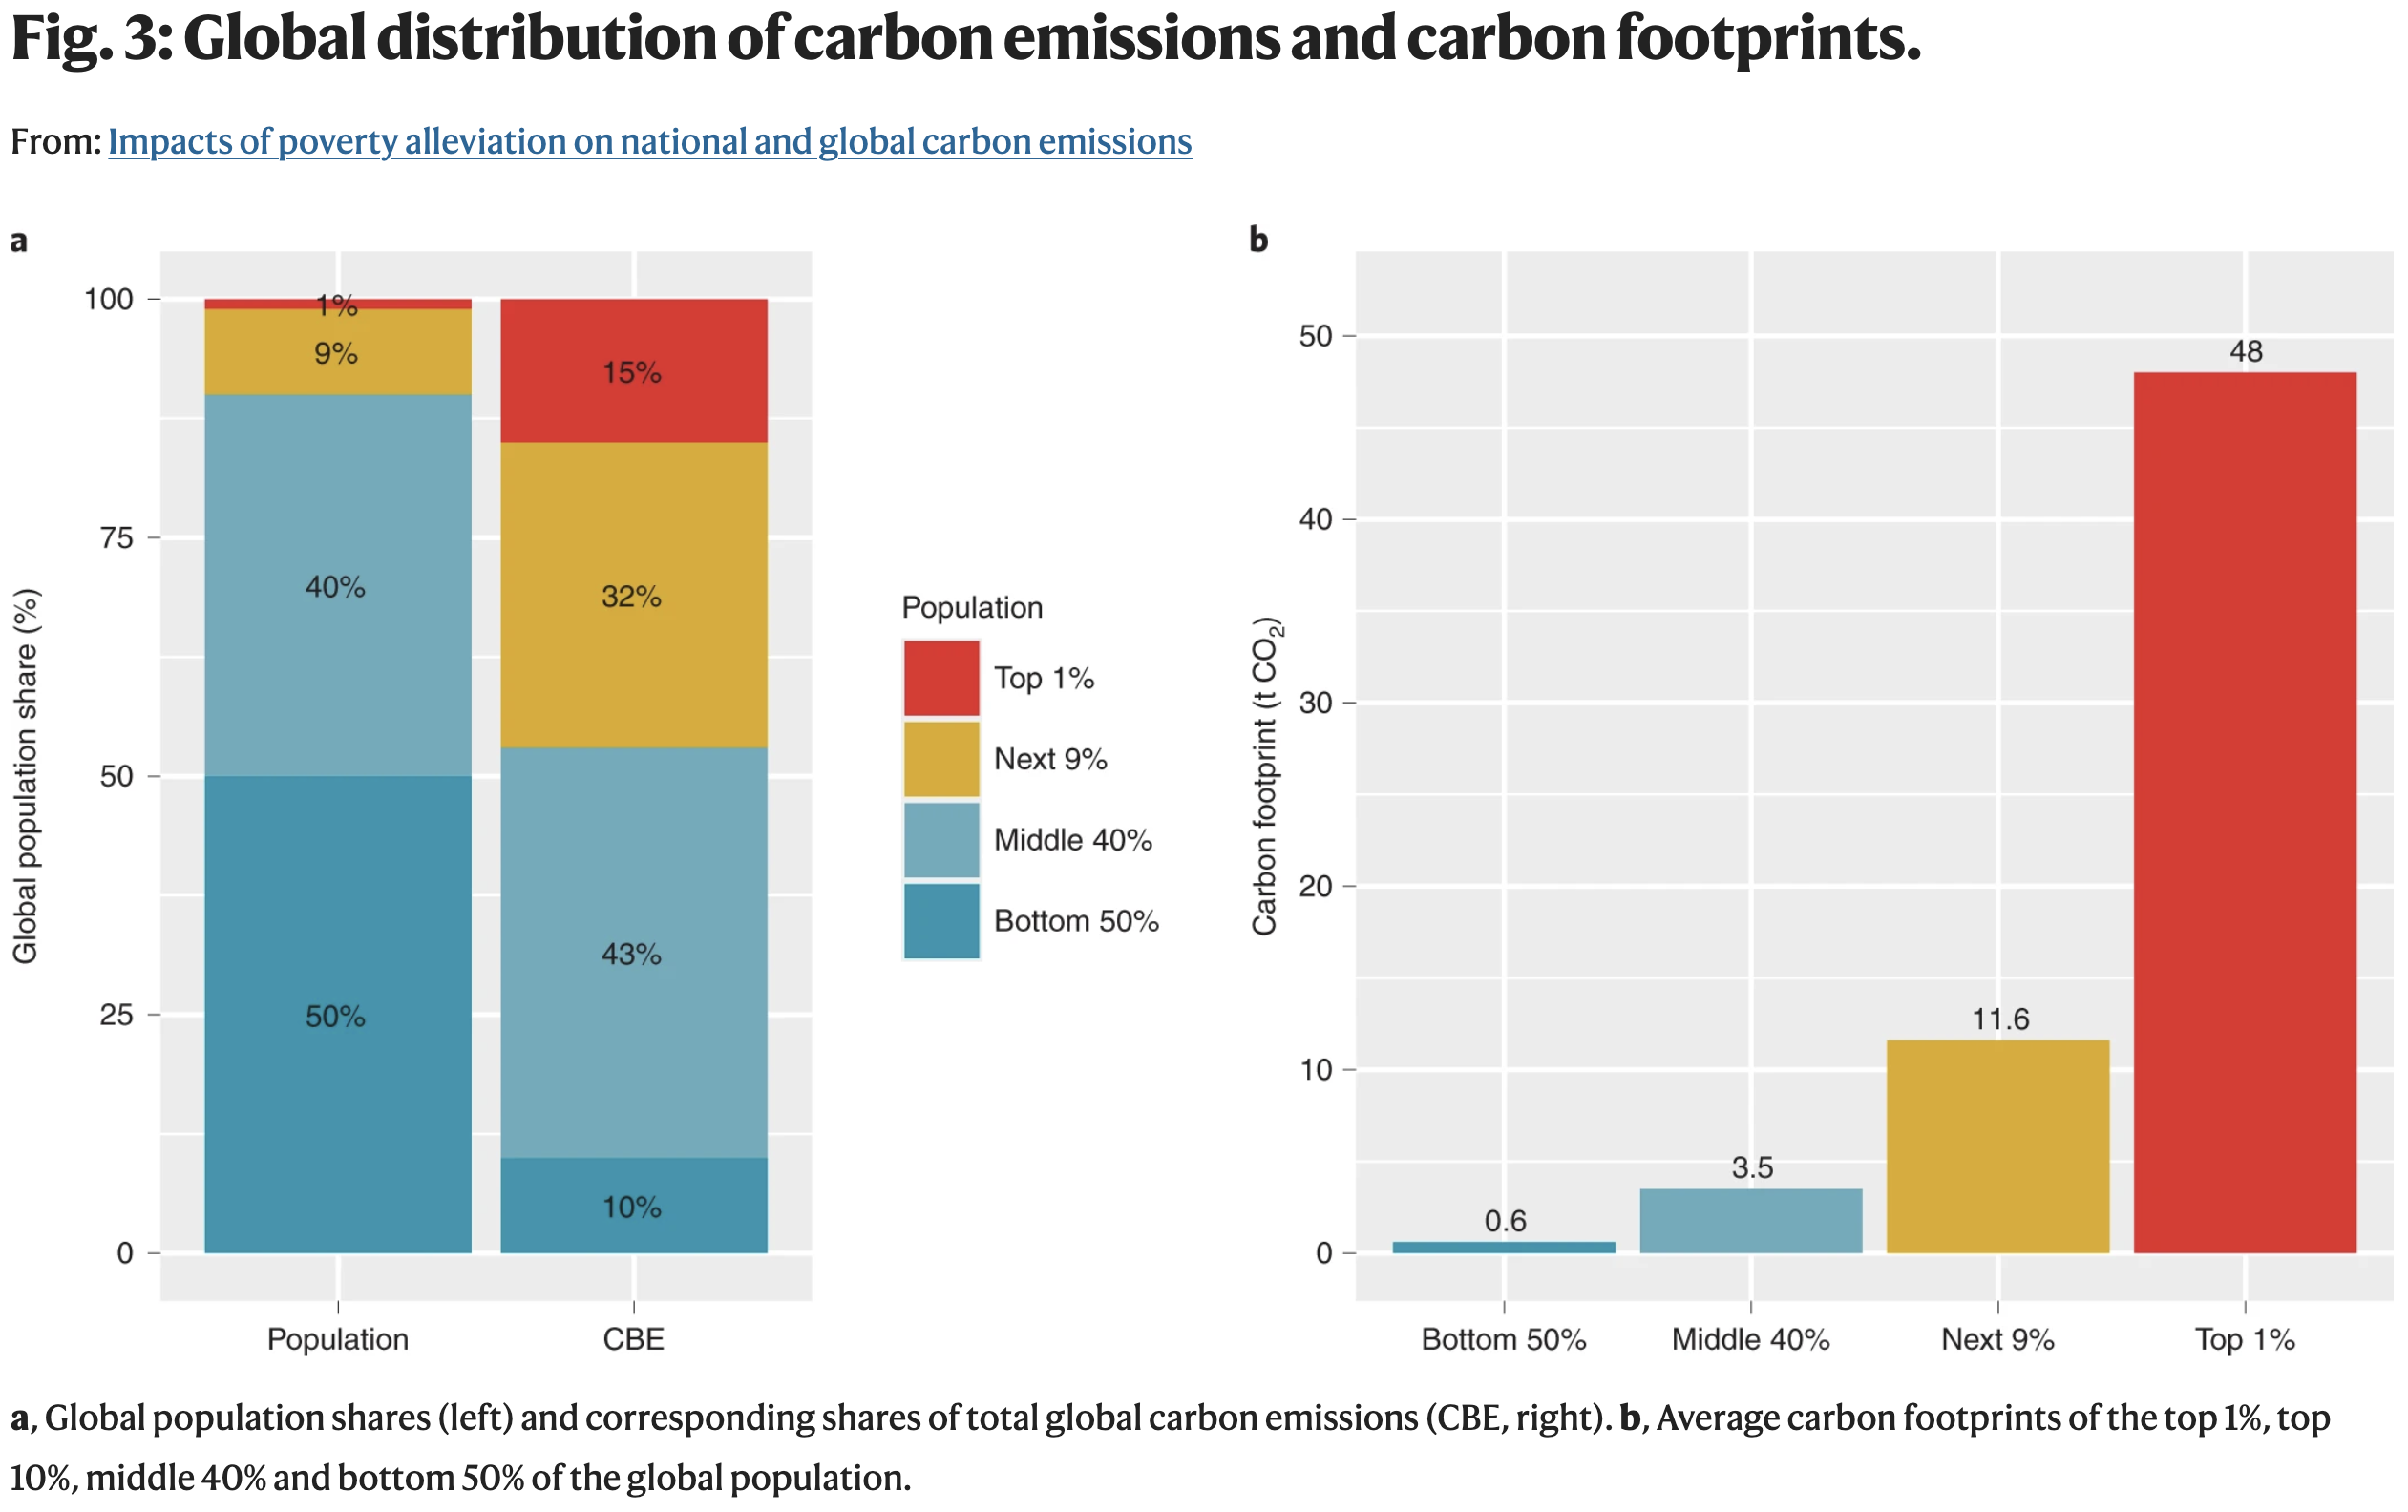
First, lets look at individuals carbon emissions in relation to their income. Carbon emissions are just like money: they are extremely unevenly distributed among individuals. There are a million people in sub-Saharan Africa whose per capita emissions are less than 0.1 tonnes of CO2 per year. And there are more than half a million super-rich individuals worldwide who are each responsible for emitting hundreds of tonnes of CO2 per year. The national average in half a dozen sub-Saharan countries is under 0.2 tonnes per person per year. To stay under 2 degrees, the global average needs to be about 2 tonnes per person per year. In 2014, it was 3.2 tonnes.
The per capita carbon emissions by share of global income are shown in the figure below (a bit complicated but worth the effort). The poorest 50 per cent of the worlds population, who on average emit 0.6 tonnes of CO2 per person per year, is responsible for one-tenth of global emissions. The richest 10 per cent is responsible for almost 50 per cent of emissions. More egregiously, the richest 1 per cent of individuals, with individual carbon footprints 75 times greater than the average in the poorest 50 per cent, is responsible for 15 per cent of emissions.
Now, lets return to the central question about relieving global poverty while keeping warming under control. Meeting the extreme poverty and all poverty goals of SDG1 would increase global CO2 emissions by up to 2.1 per cent. In the unlikely event that wealthy individuals and countries felt incredibly generous and ensured that all the 3.6 billion poorest people in the world had a daily income of at least US5.50 (a princely sum indeed I could buy a piccolo latte and have change for that) global emissions would increase by 18 per cent a fraction more than the collective emissions of the worlds richest 1 per cent (roughly 80 million people).
The study authors conclude: poverty alleviation is still possible with minor increases in global carbon emissions. [However], the focus on developing countries should not divert attention from the need for drastic emission reductions in high-income countries with unsustainable consumption patterns. Investigating emission patterns of the super-rich is key to reducing carbon emissions.
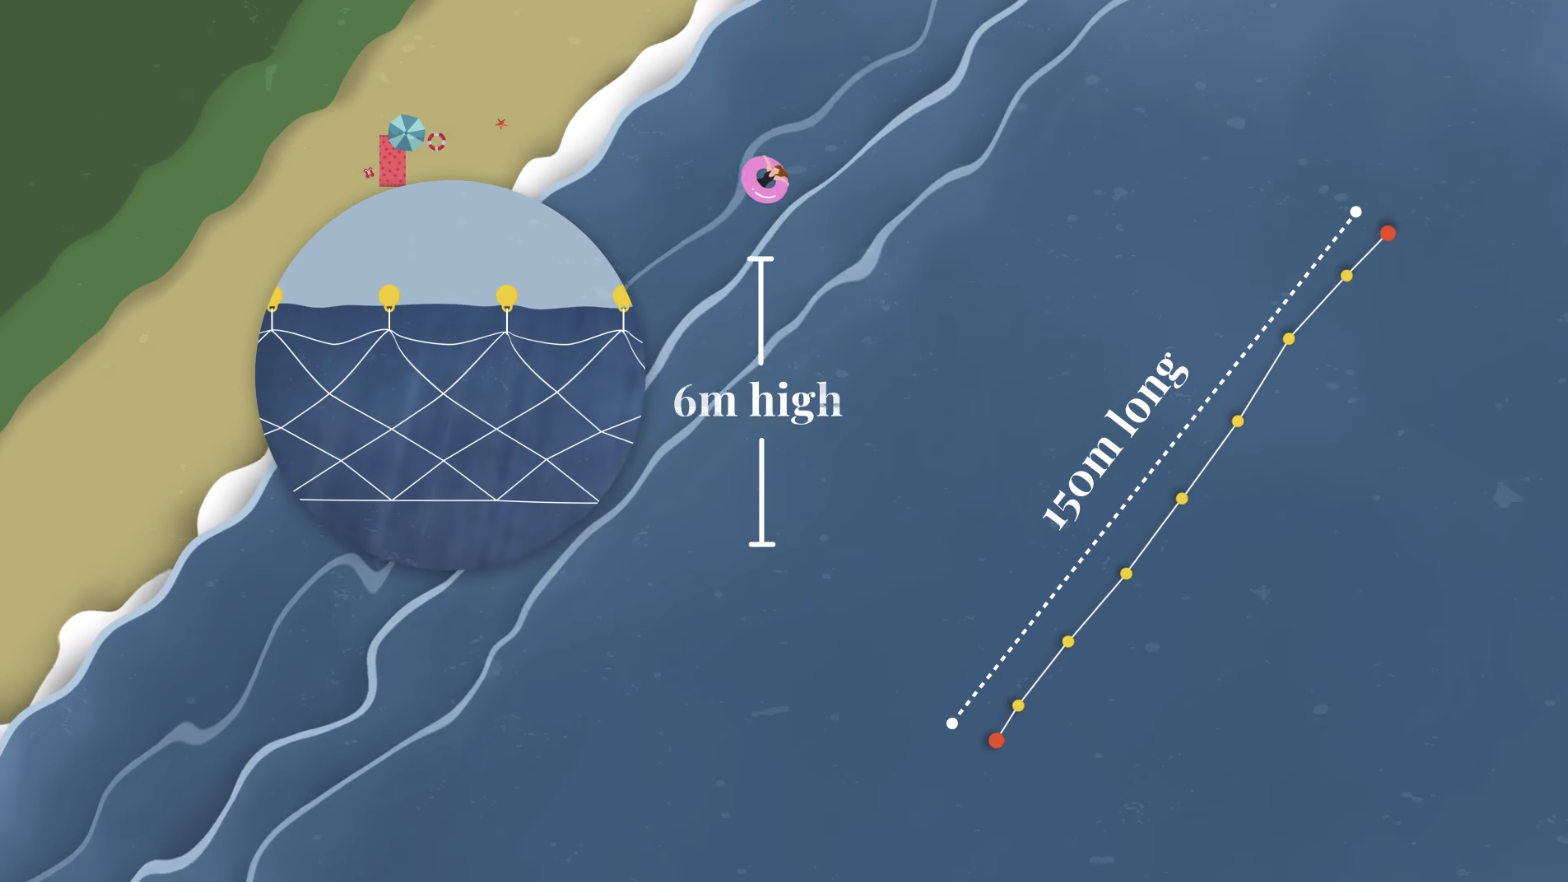
What do shark nets net?
Shark nets keep our beaches safe, right? No, not really, and thats not surprising as they are only 150 metres long and go only 6 metres deep. Forty per cent of sharks caught in the nets are caught on the way out from the beach. Shark nets are, however, very good at trapping and killing other animals such as whales, dolphins, turtles and rays. Education systems and signs on beaches can help protect humans but were not terribly good at following such advice. Drone monitoring and personal protective devices provide better protection for people in the water. We need to get rid of shark nets: they dont protect humans and they inflict a lot of collateral damage.
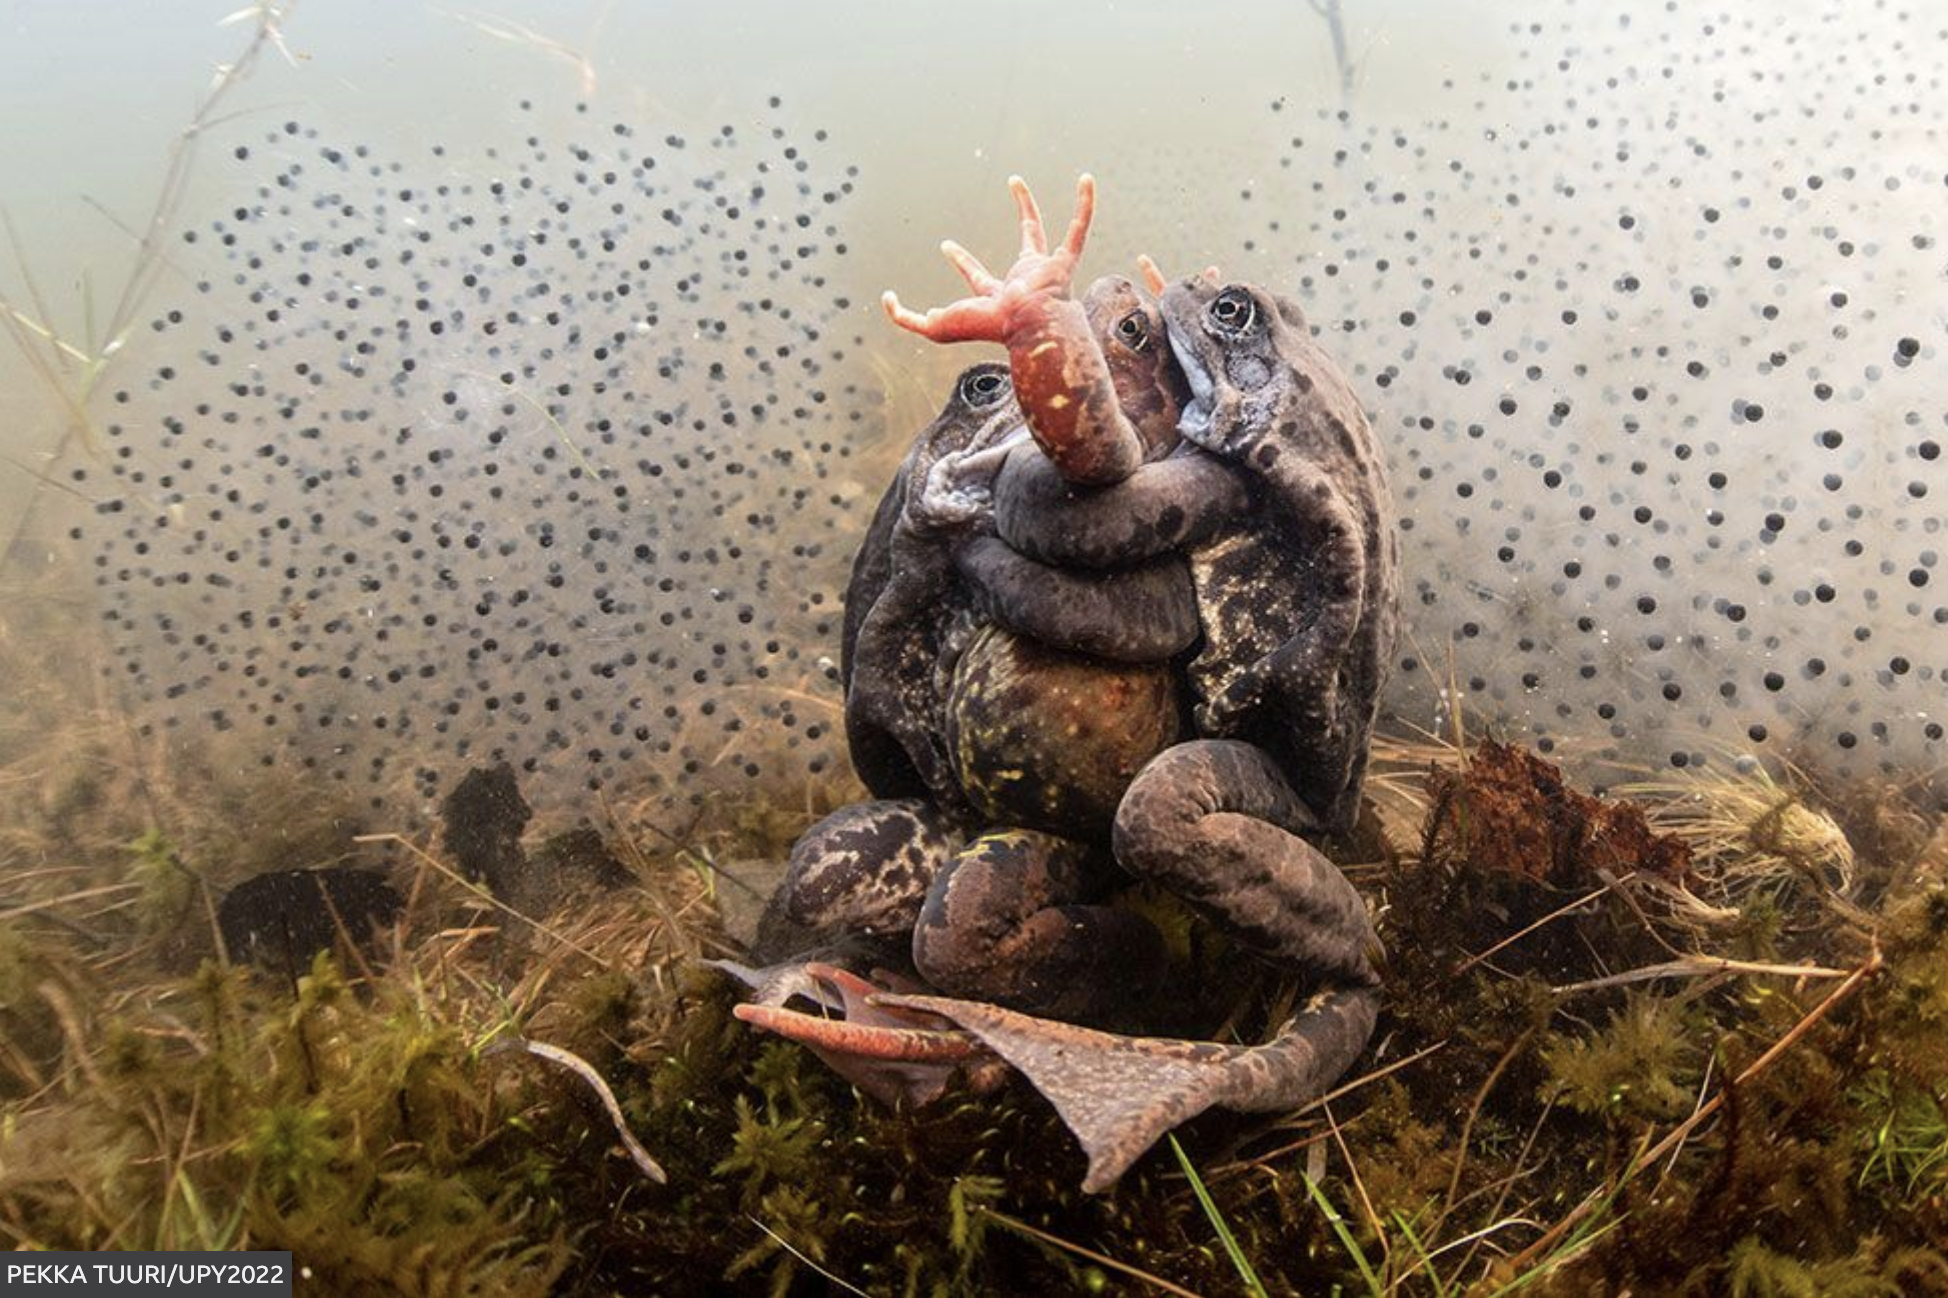
Froggy finish
The Finnish Frogfest below wasnt the overall winner in the Underwater Photographer of the Year awards but its my favourite.
And this article, featuring a new species, peatbogs, frogs and chocolate, is just about my perfect finish to the week.