Environment: Who are the green groups pocketing dirty dollars?
June 3, 2023
Fossil fuel companies burnish their image with environmental sponsorships. Lakes and reservoirs drying up around the globe. China dominates the production of solar panels.
Environmental charities taking the fossil fuel dollar
350 Australia, the local branch of the organisation started by Bill McKibbin, and the Climate Council have launched a Fossil Fuel Free Pledge which aims to undermine the social licence of gas and coal companies in Australia.
The Fossil Free Sponsorships program is encouraging arts and community organisations to pledge not to accept sponsorship from fossil fuel companies, a policy supported by over half of Australians. Eight organisations have so far signed the pledge and more are considering it. 350 is approaching organisations with links to fossil fuel companies to encourage them to cut their links.
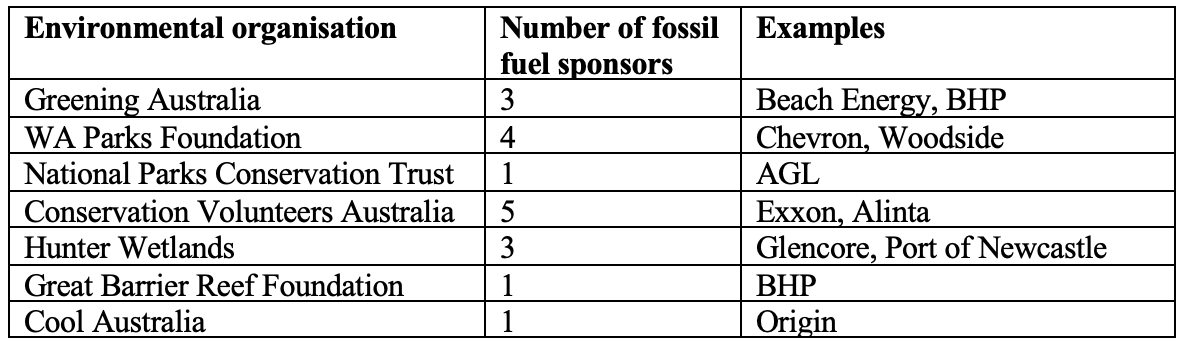
A very useful, and in some cases surprising, aspect of the program is an interactive database of partnerships between fossil fuel companies and sports, arts, health, research, educational and community groups. The information has been drawn from the organisations own websites and, disappointingly, I found some environmental organisations on the list. For instance, according to the website:
Beyond environmental groups, it was not surprising to see that Newcastle University has ten identified partnerships and interesting that the McGrath Foundation has two.
The Climate Council has also produced online information to assist organisations to take the pledge.
If any of you are associated with an organisation that is sponsored by a fossil fuel company, you might want to encourage them to take the pledge. And if any of you donate to charities that do good work, you might want to search the Fossil Free Sponsorships database before making another donation to check the organisations other donors.
Water guzzling almonds
While there was variation related to both year and place, it took an average of 12 litres of water to produce every almond in California between 2004 and 2015. That is not a typo:12 litres for every single almond nut or 10,000 litres for every kilogram. On the other side of the farmers balance sheet, almonds have extremely high nutritional value and provide the farmer with a relatively high income per kg produced.
The graph below shows the ranking of 43 Californian crops on nutrient value on the vertical axis and on water footprint on the horizontal axis. The display is a bit counterintuitive: the highest ranking (most desirable) nutrient value crops are those with a value closest to 10 and the crops with the lowest water footprint are those with a value closest to 0. So, for example, spinach requires little water and has high nutrient value Popeye could have told us that. Its interesting to see that nuts, oats and potatoes have high water demands and many fruits have relatively low nutrient value.
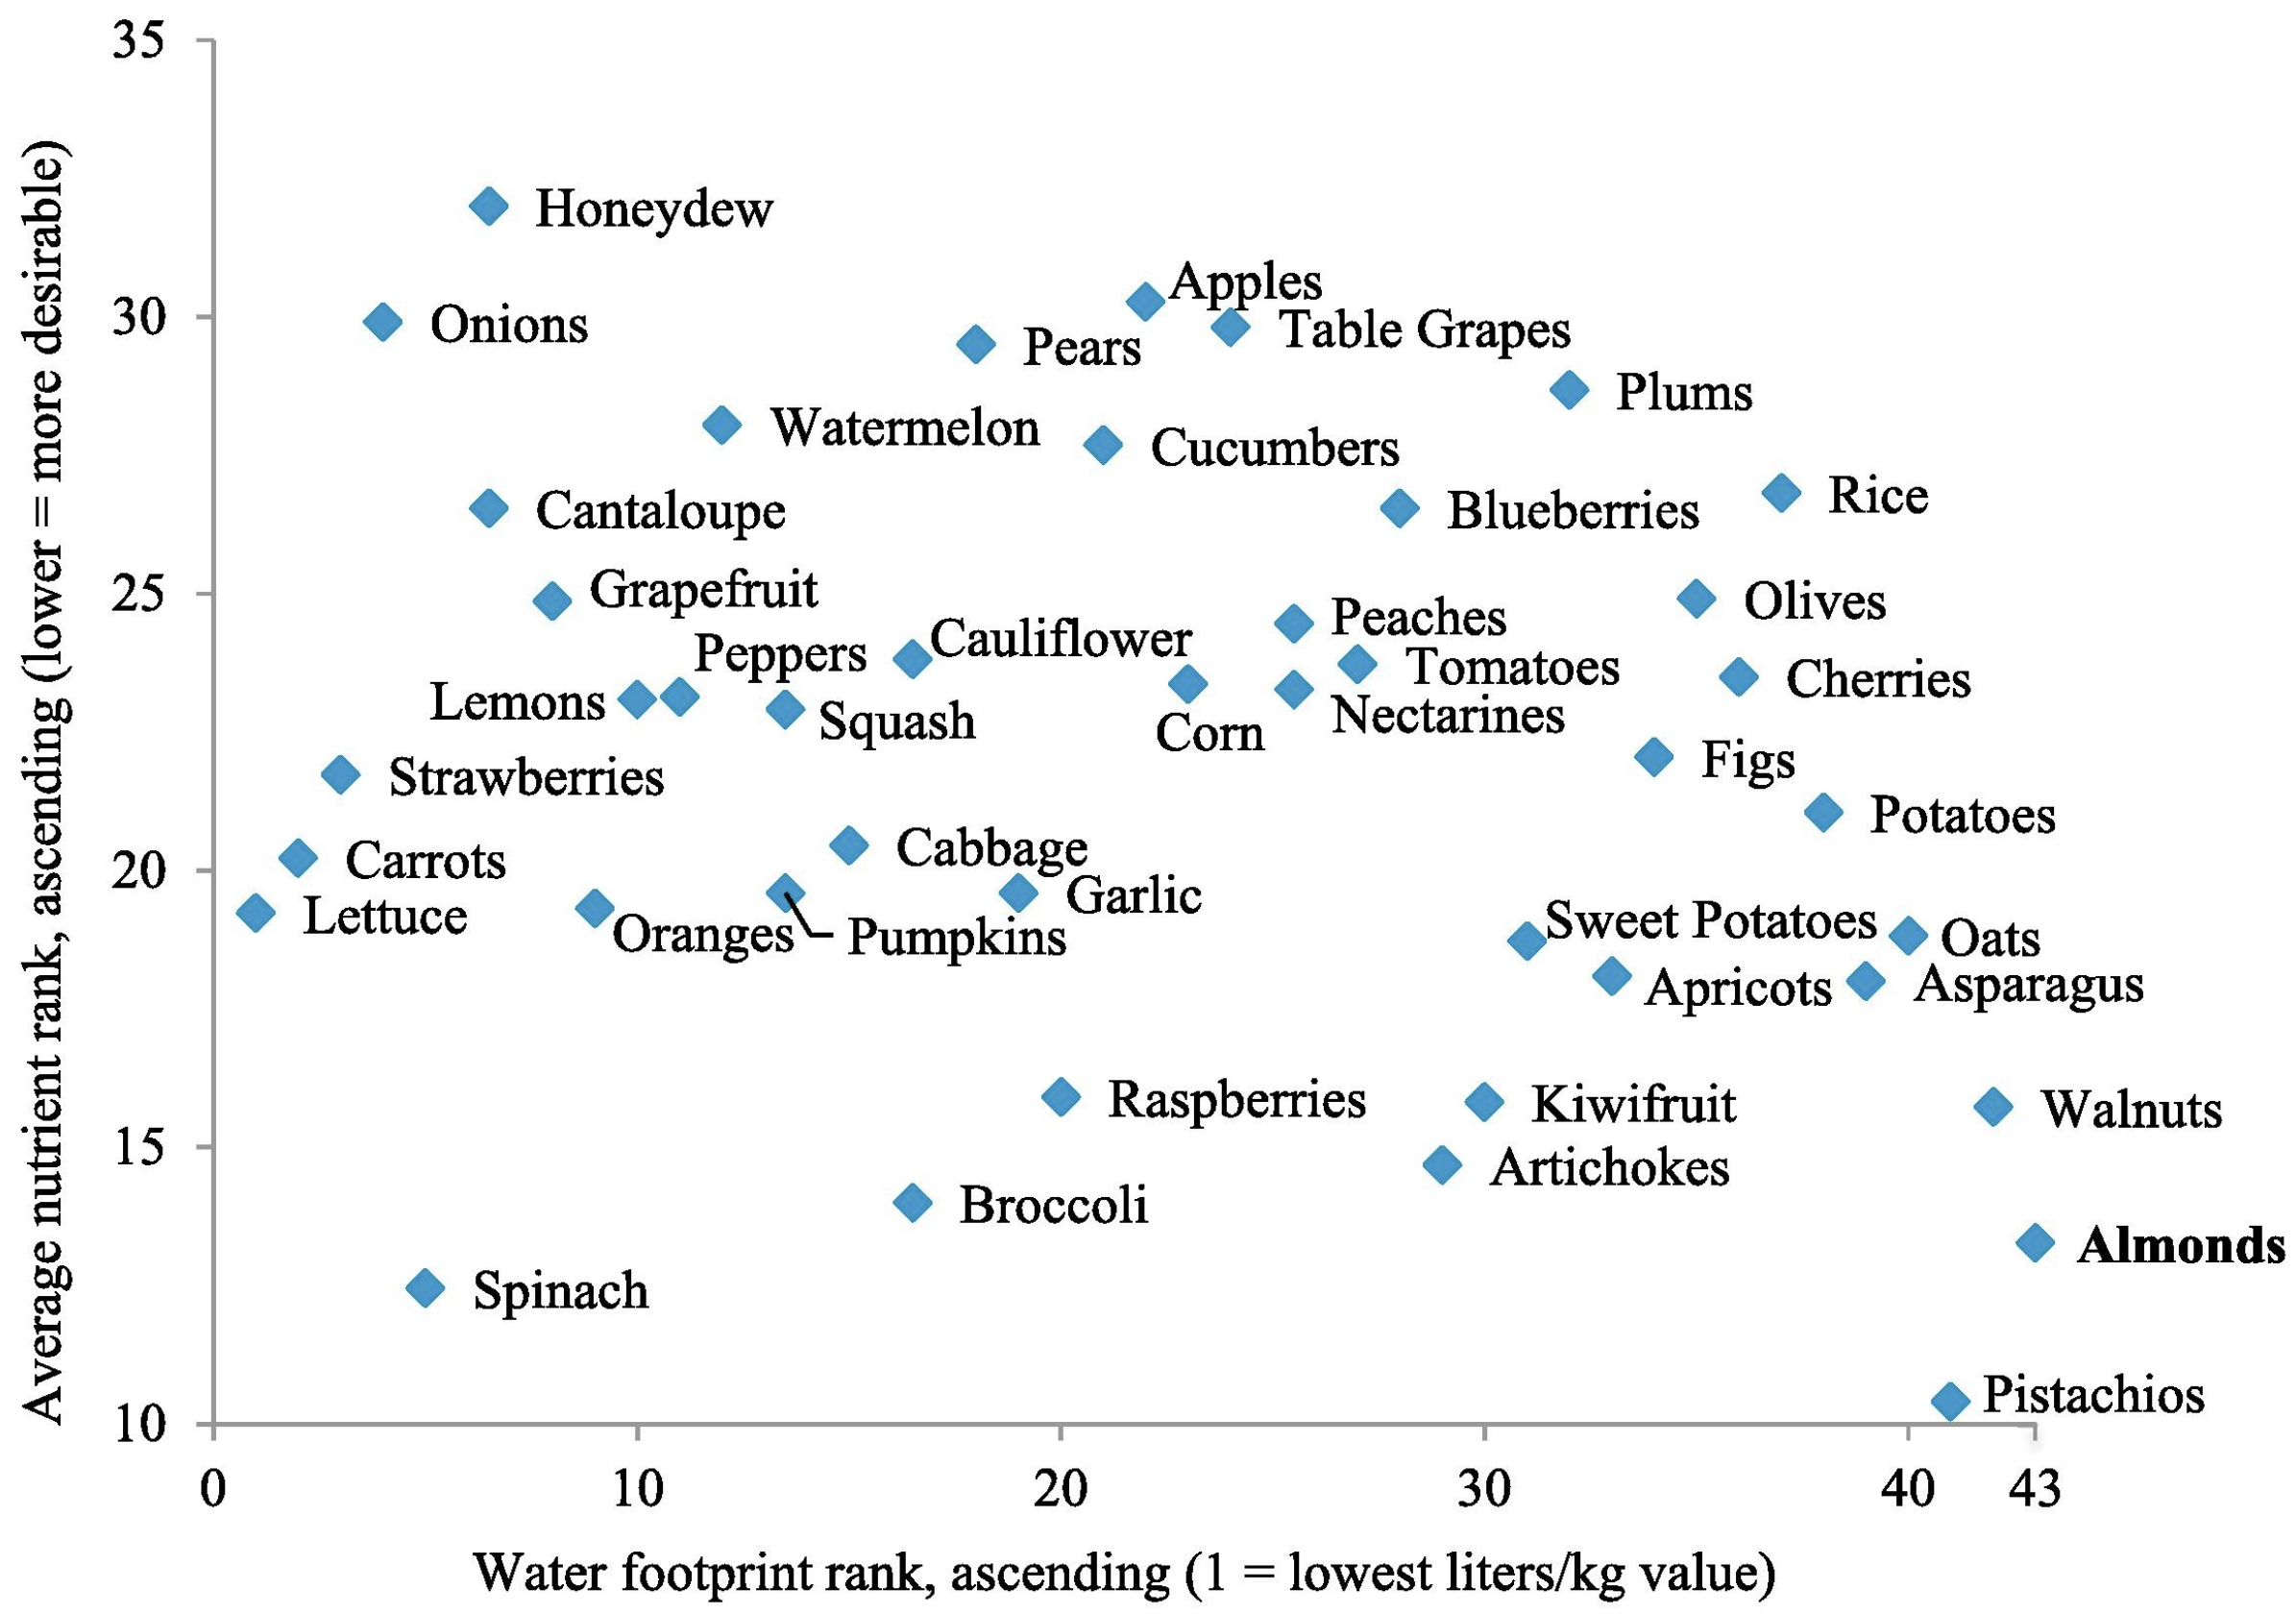
My homemade muesli containing rolled oats, flaked almonds, dried apricots, sultanas and raisins served with poached plums, peaches or nectarines may get me off to a good start to the day but it is not looking too good in terms of water usage or nutrients. Add in the yoghurt and my green credentials are beginning to look distinctly murky.
Lakes and reservoirs have lost half their water
Lakes cover 3% of the worlds land area. They fulfil many essential functions: habitat for all manner of animals and plants, cycling of carbon, nutrients and pollutants, provision of fresh water for human drinking and crop irrigation, and recreational opportunities. These functions are affected by the amount of water in a lake, which fluctuates naturally and changes as a result of human activities and now climate change. Concern has been expressed about dramatic reductions in the water storage of some large lakes in recent decades.
Over the period 1992-2020, the water stored in the worlds largest 1972 natural lakes and reservoirs, accounting for approximately 90% of Earths total freshwater storage, decreased overall by 53%. Two-fifths of lakes and two-thirds of reservoirs experienced severe water losses over this period and the trend was not limited to arid areas; it was also observed in the humid tropics and high latitude areas.
Australia was not spared, with about 25 lakes (the darker red dots) and reservoirs (the pink dots) experiencing losses The grey dots represent lakes and reservoirs with no change in water storage over the period. The brown on the map represents arid areas and the grey humid areas.
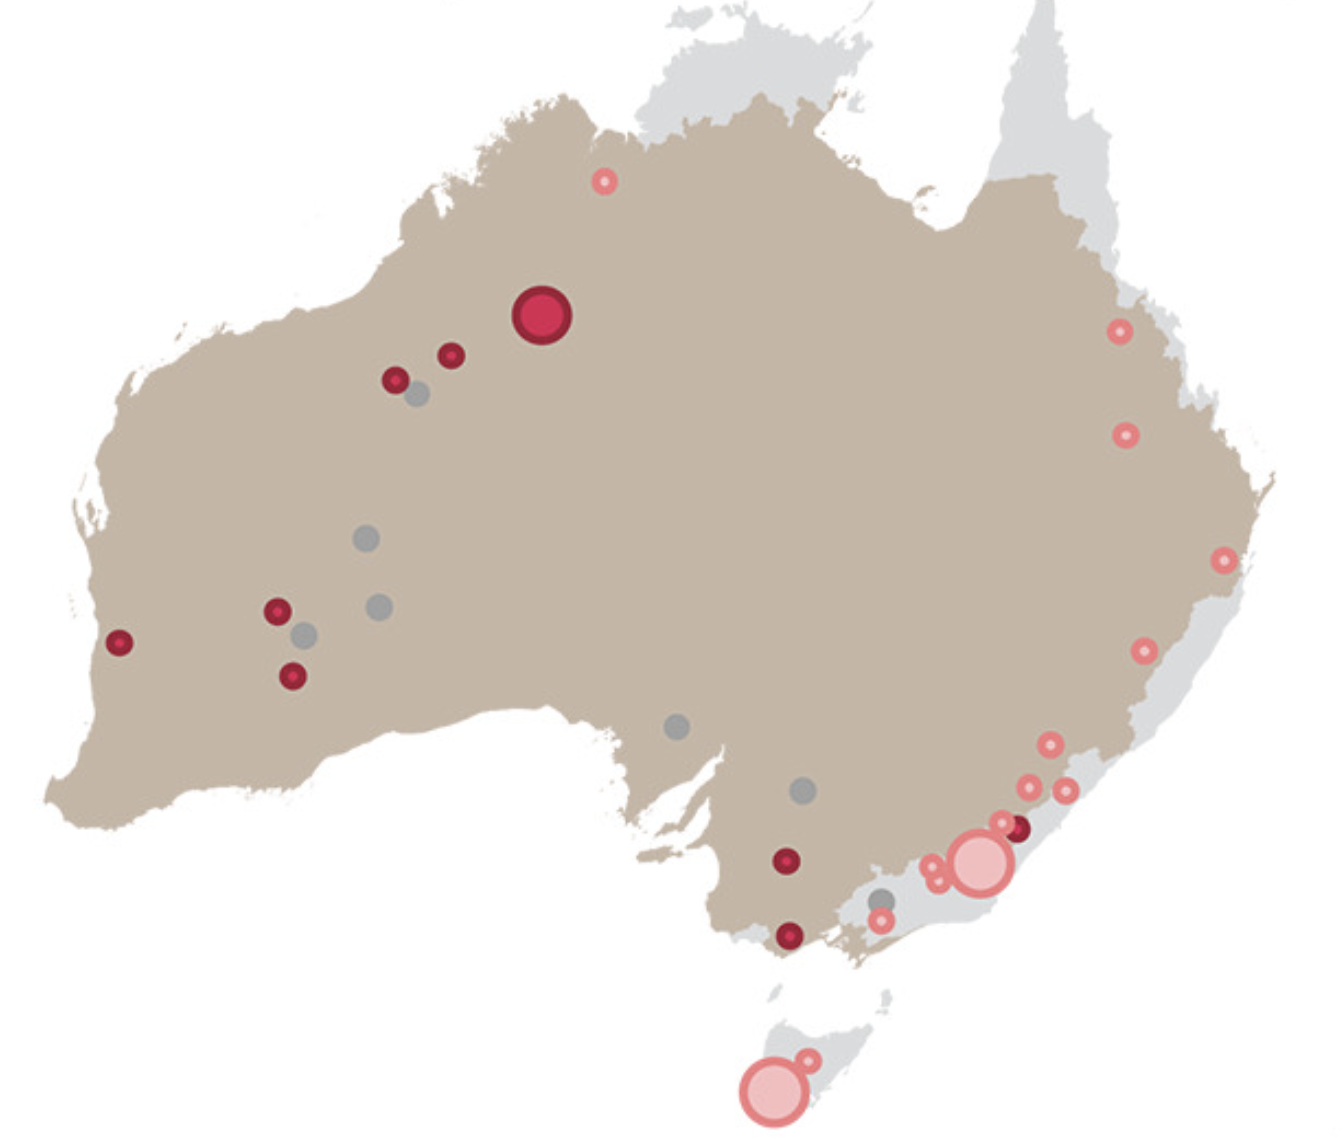
The loss from lakes was largely attributable to human consumption and global warming which increases evaporation. The loss from reservoirs was mainly caused by increasing sedimentation. Approximately a quarter of the worlds population lives in the basin of a drying lake and many of the lakes and reservoirs are sources of hydropower. Many are recognised under the Ramsar Convention as sites for the conservation and wise use of all wetlands through local and national actions and international cooperation.
The reports authors conclude that drying trends are more extensive worldwide than previously thought and they express concern about the consequences of continued global warming. The also recommend greater attention to reducing sedimentation in reservoirs and more effective water conservation.
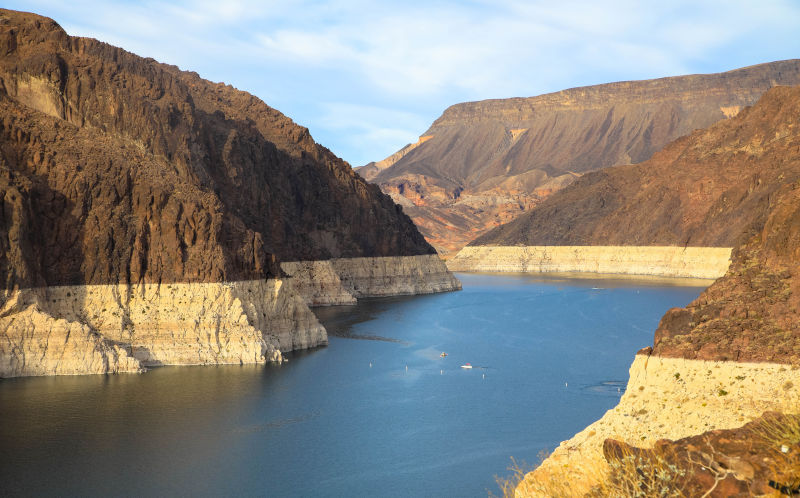
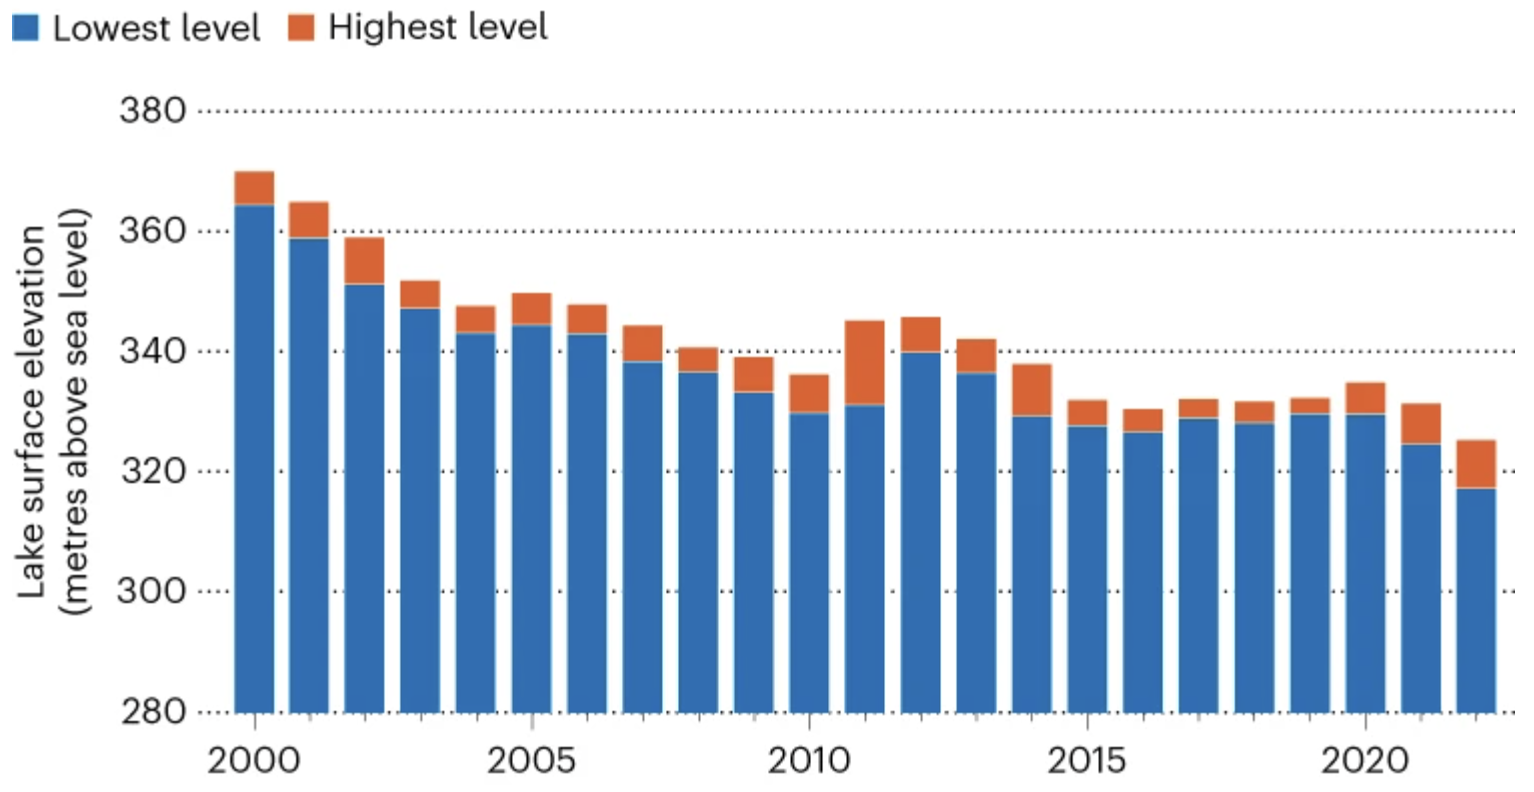
Lake Mead is a reservoir in Nevada and Arizona created by the building of the Hoover Dam on the Colorado River in 1930s to produce water for consumption and hydroelectric power.
Storage in Lake Mead has been falling for decades (graph below) as a result of water being taken from the Colorado River by the seven states it traverses during its 2,300 km journey. More recently, a long running drought and climate change every 1oC rise in temperature in the upper part of the river basin causes a 9% drop in the rivers flow have added to the problem. About three-quarters of the water taken from the river is used for agriculture, much of which produces fodder for livestock.
China dominates solar panel production
The manufacturing of solar photovoltaic panels increased at a compound annual growth rate of 25% during 2010-2021. In 2022, 260 GW of solar panels were produced globally and this is only 40% of the production capacity. About 90% of the current growth in production capacity is occurring in China.
Globally during the first three months of 2023, there were announcements to build thirteen new facilities each capable of producing at least 20 GW of solar units each year; twelve of these were in China and the thirteenth in India. All of the facilities are expected to be complete by 2024 and to be operating at maximum throughout by 2026 at the latest.
These thirteen projects accounted for 45% of the total additional capacity announced during the first quarter of 2023. If all the project announcements come to fruition the solar manufacturing capacity in 2030 will greatly exceed the needs of the Net Zero Emissions by 2050 scenario produced by the International Energy Agency. In fact, only half of the projects would need to succeed bearing in mind the potential to increase the current 40% production capacity.
Cumulative CO2 emissions 1850-2021
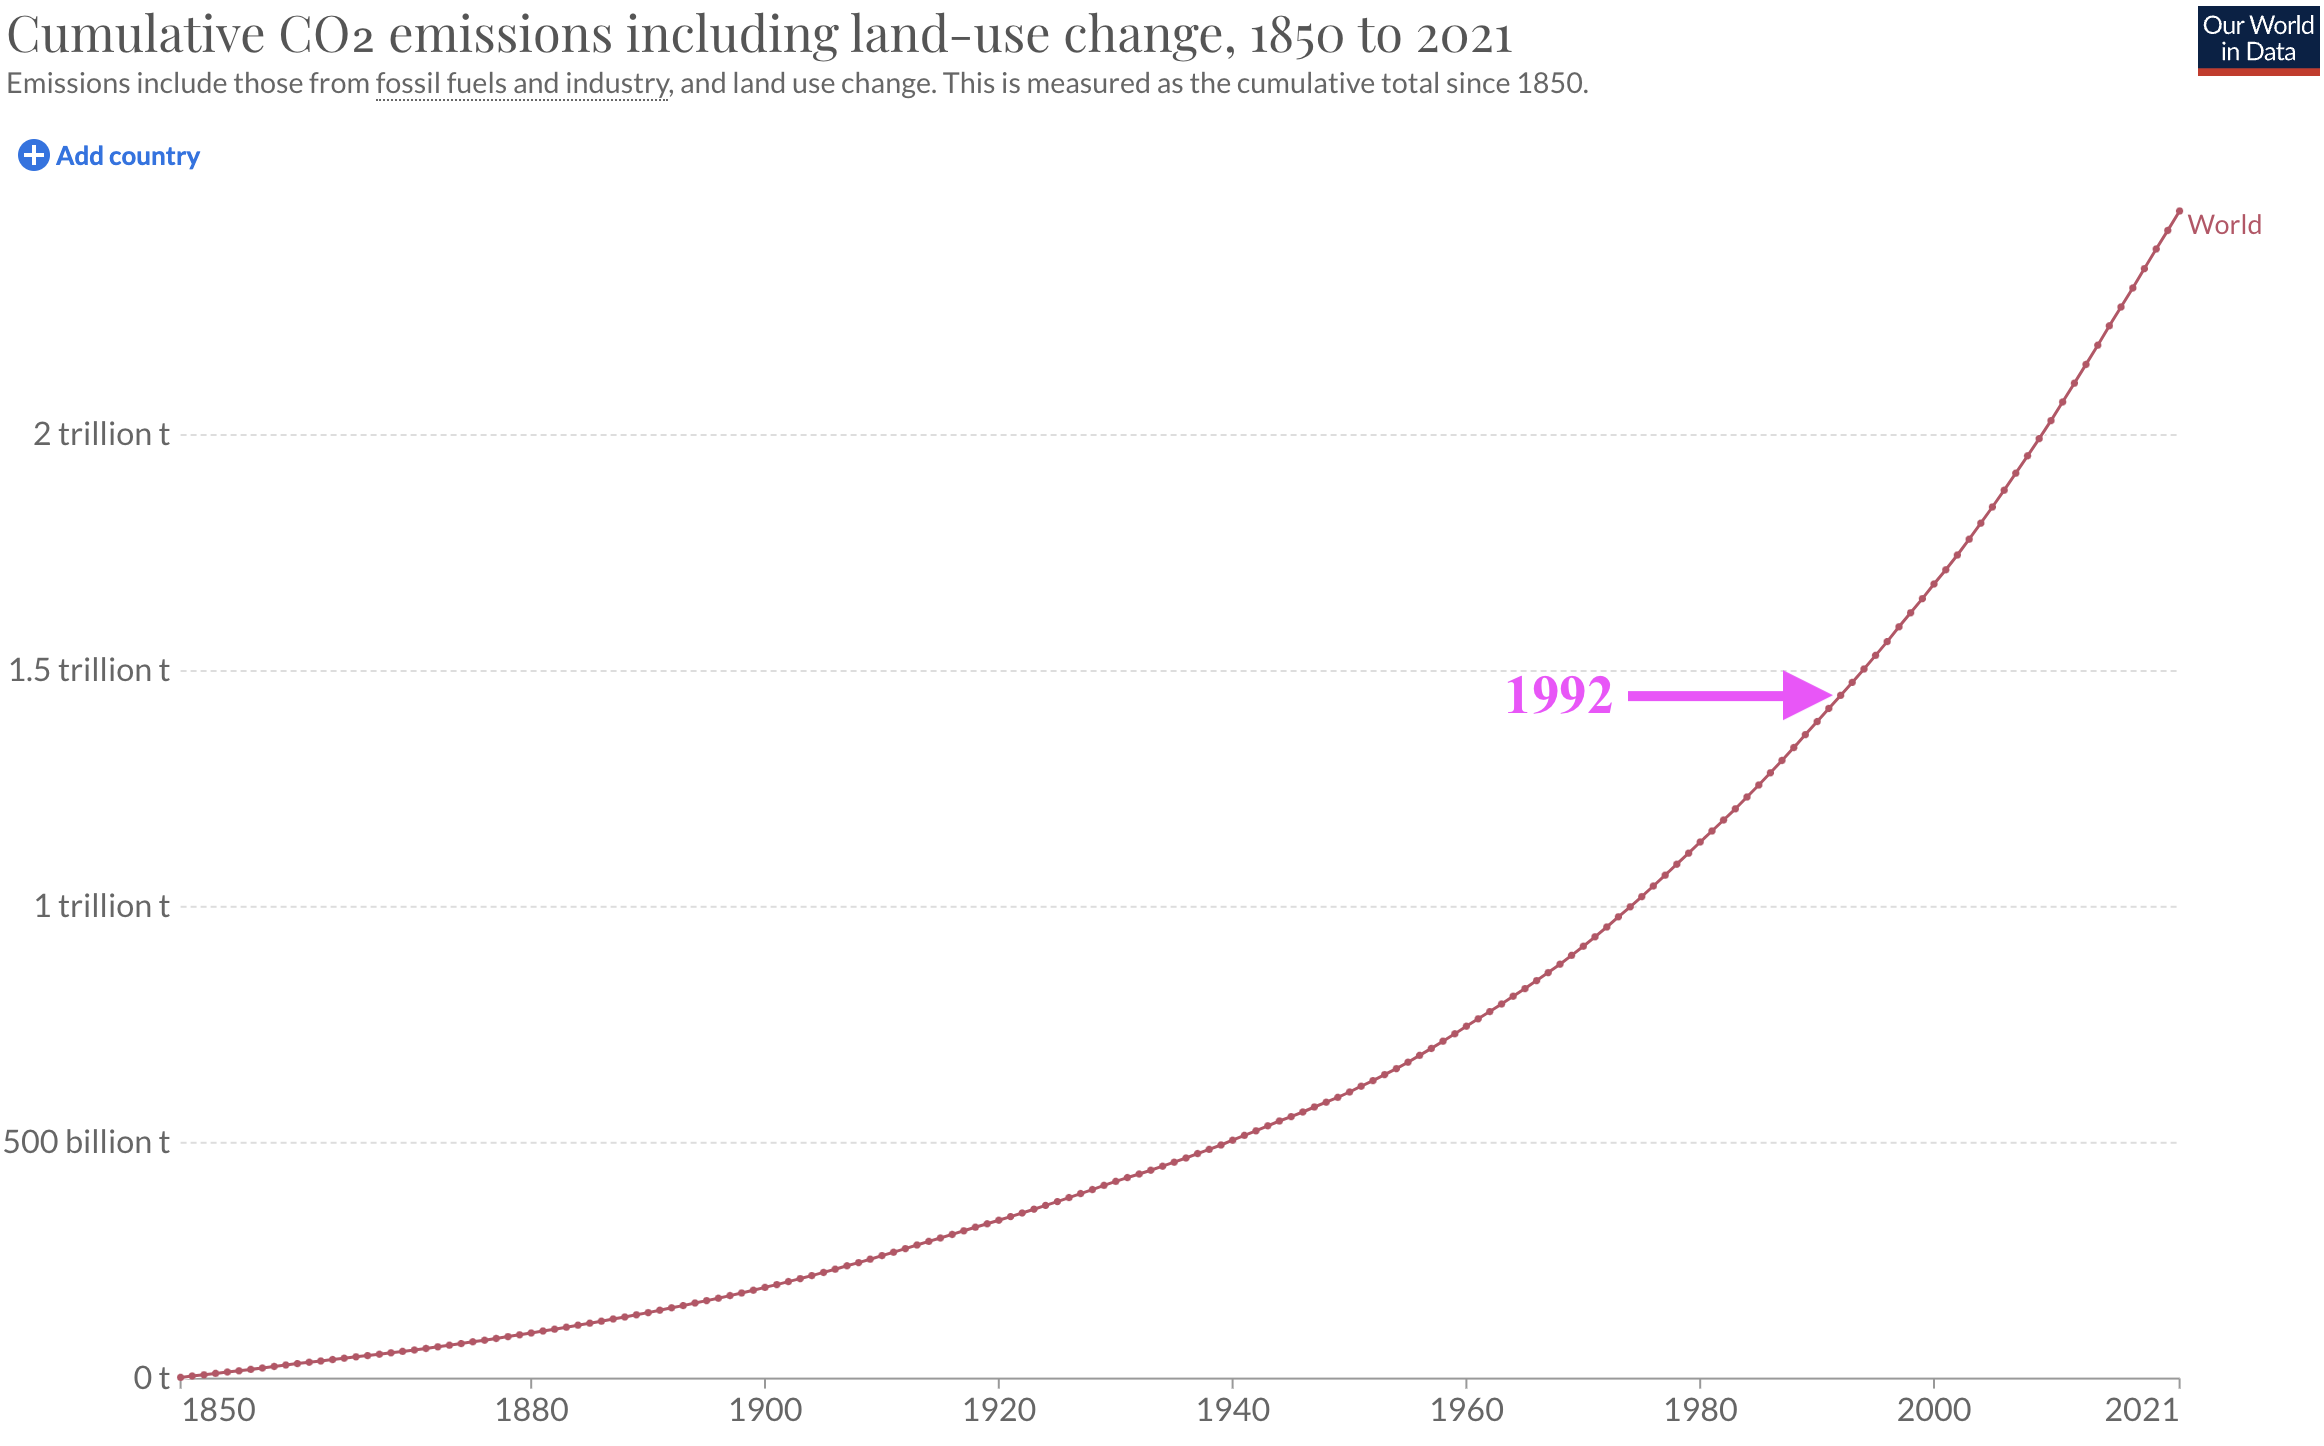
The graph above tells a couple of very interesting stories:
- It took 100 years for the world to produce the first 25% of the cumulative total of CO2 emitted by 2021. The next 25% took 33 years, the next 25% 21 years, and the last 25% took 16 years.
- The world has produced 41% of the cumulative emissions up to 2021 since the United Nations Framework Convention on Climate Change was signed in 1992. Hardly a demonstration of great success for the UNFCCC. The best one can say is that while the curve was getting steeper and steeper for 160 years, since about 2010 it looks to be linear. So maybe after 20 years of work the UNFCCC stopped us accelerating towards the cliff. Now we are simply hurtling to oblivion at a steady speed.
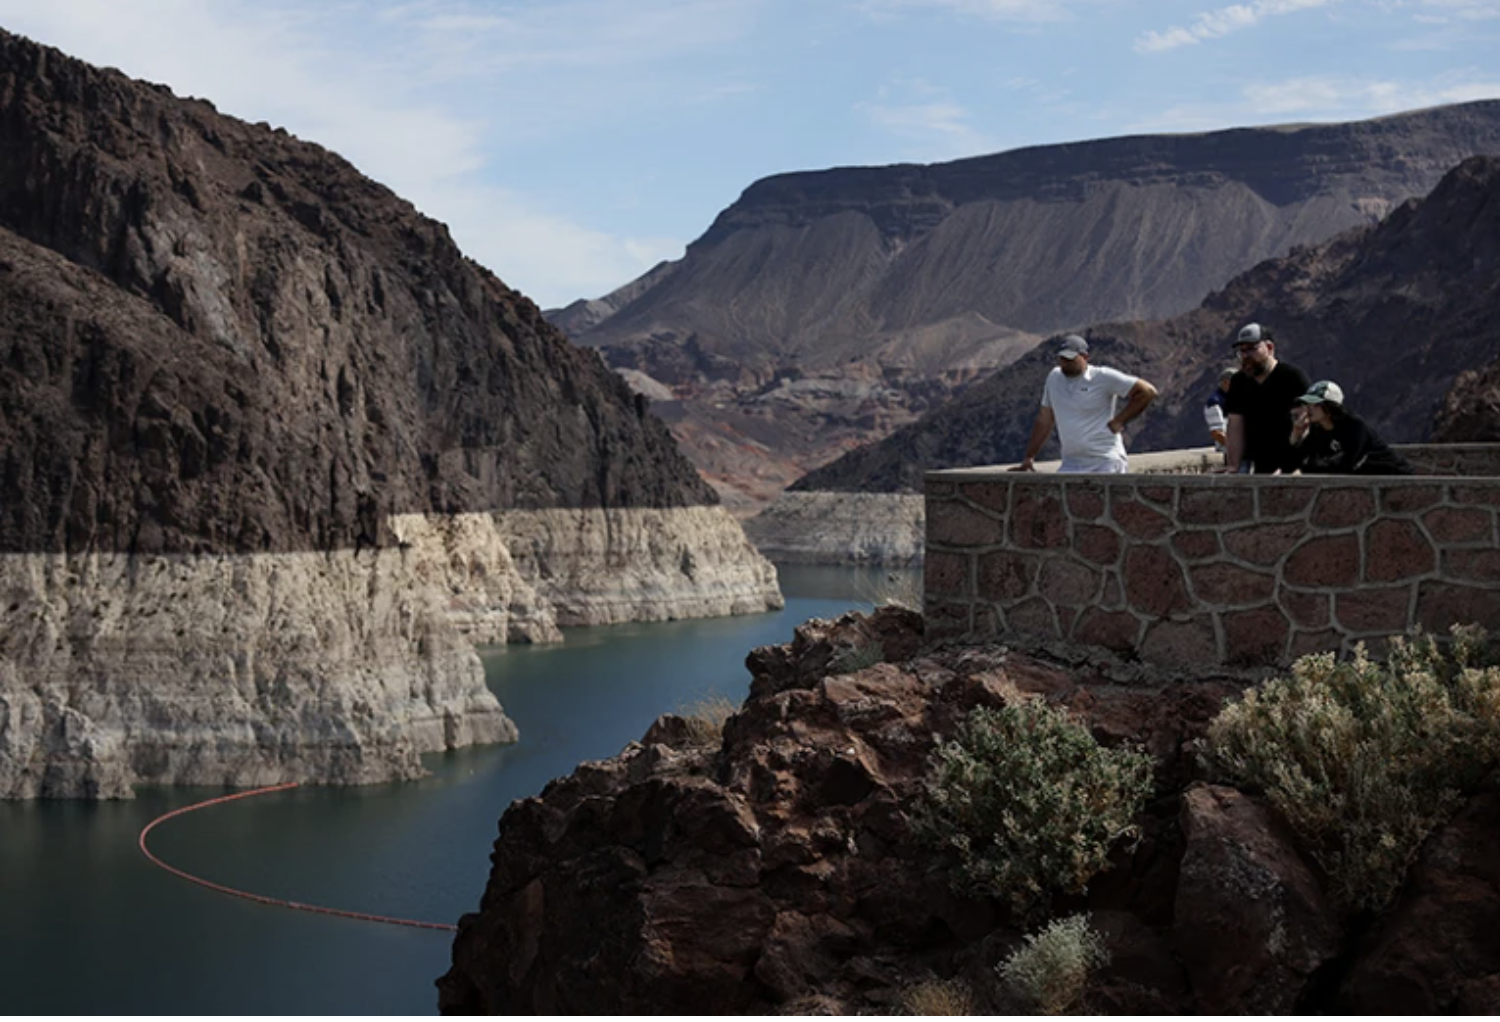
Lake Mead - majestic but failing
Lake Meads falling water level is beautifully illustrated in the picture below.
Herbert Hoover, the US President who graciously gave his name to Lake Meads dam, quipped, All men are equal before fish.
Deng Xiaoping, paramount leader of China after Mao, was rather more pragmatic with his animal metaphors, It doesnt matter if the cat is black or white, so long as it catches mice.
Peter Sainsbury, sanctimonious pessimist, muses, It never looks good for the bilby to be riding on the foxs back.