JOANNE SIMON-DAVIES. Housing in Australia (Australian Parliamentary Library 2.8.2019)
August 15, 2019
_The Australian Bureau of Statistics (ABS) recently released data from 2017-18Survey of Income and Housing (SIH). The SIH is a household survey which collects information on sources of income, amounts received, household net worth, housing, household characteristics and personal characteristics of persons aged 15 years and over in private dwellings throughout Australia (excluding very remote areas).
_
This Flagpost provides a summary ofhousing occupancy and costs of housingin Australia.
Australian households
Fewer people owned their own homes with or without a mortgage in 2017-18 compared to those in 1997-98; in contrast, households who rent have increased:
- 30% own their own home without a mortgage, compared to 40% in 1997-98
- 37% owned their own home with a mortgage, compared to 31%
- 32% were renting compared to 27%
- 27% were renting from private landlords (an increase from 20%)
- 3% from housing authorities (decrease from 6%).
Figure 1 proportion of households by tenure type, 1997-98 to 2017-18
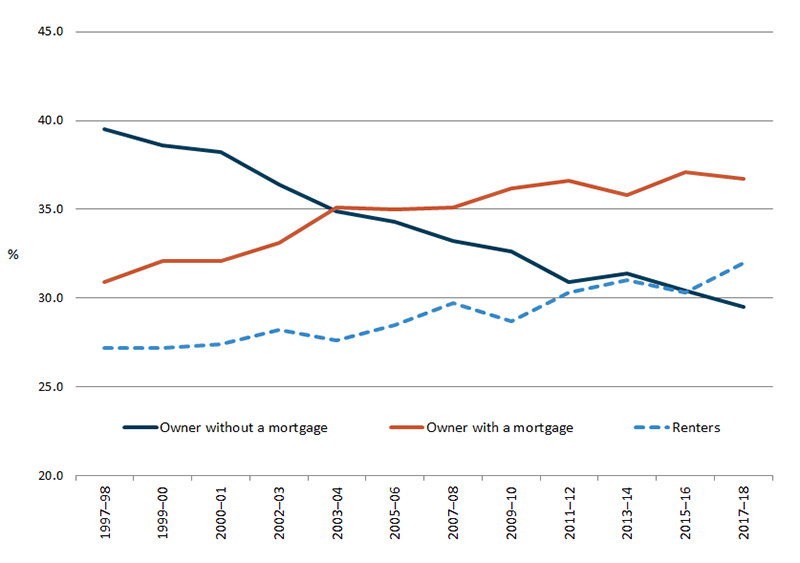
Source: ABSHousing Occupancy and Costs, Australia, cat no. 4130.0, 201718
When looking at age of home owner/renter, older Australians, 65 years and over were more likely to own their own home than any other age group (see Figure 2 below); however this has declined slightly since 2007-08:
- 79% of those 75 years and over (compared to 80% in 2007-08)
- 70% of those aged 65-74 (compared to 76%).
In contrast, younger Australian households were much more likely to be renting, 86% of those aged 15-24, 61% of 25-34 year olds and 37% aged 35-44, this compares to 83%, 54% and 33% in 2007-08.
Figure 2: households by tenure type by age of reference person, 2017-18
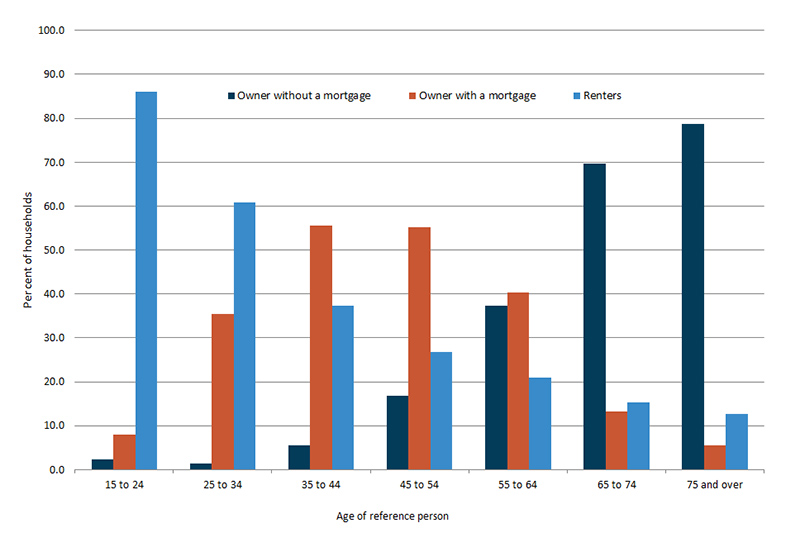
Source: ABSHousing Occupancy and Costs, Australia, cat no. 4130.0, 201718
Housing costs
Housing costs are defined as the sum of rent payments; rate payments (water and general); and mortgage or unsecured loan payments (if the initial purpose of the loan was primarily to buy, add, or alter the dwelling). According to the ABS, complexities in measuring different types of housing costs mean that care should be taken when comparing housing costs and affordability ratios across tenure types. In 201718, the average weekly housing costs for all Australian households were $311 but vary significantly for different tenure types.
- $484 for owners with a mortgage
- $366 for renters.
In the past two decades, from 199798 to 201718, housing costs (adjusted for inflation) for major tenure and landlord types have increased by:
- 40% for home owners with a mortgage
- 52% for state or territory housing tenants and 51% for private renters.
Housing affordability
Lower income households are those containing the 38% of persons between the 3rd and 40th percentiles of equivalised disposable household income. The table below shows that those living in the Sydney Greater Capital City area have a higher percentage of lower income renter households paying more than 30% of their income on housing costs (58% of all lower income renter households) compared to other capital cities, such as Brisbane (40%) and Adelaide (38%).
Table 1: proportion of lower income renter households (a) paying more than 30% of income on housing costs: by states and territories, 201718
| States and territories | Greater capital city area | Rest of state | Total |
|---|---|---|---|
| NSW | 57.7 | 37.3 | 48.3 |
| Vic. | 45.8 | 32.1 | 43.9 |
| Qld | 39.9 | 41.9 | 40 |
| SA | 38 | 20.4 | 32.4 |
| WA | 49.7 | 36.9 | 46.6 |
| Tas. | 24.7 | 22.7 | 24.2 |
| NT (a) | 42.2 | 16.1 | 41.3 |
| ACT (b) | 42.7 | n/a | 42.7 |
| Australia | 47.8 | 35.6 | 43.1 |
Source: ABSHousing Occupancy and Costs, Australia,cat no. 4130.0,201718 (Table 21)
(a) Households in very remote areas were excluded, accounting for about 22% of the population of Northern Territory. (b) Greater capital city areas estimates for the ACT relate to total ACT. Note: Those in red have a high margin of error and should be used with caution.
For selected lower income household groups, the percentage spending more than 30% of their gross weekly income on housing was:
- just under half (45%) of one parent families with dependent children
- more than a third (35%) of couple families with dependent children
- over a quarter (29%) of lone person households
- around half of households with younger reference persons aged 1524 (55%), 2534 (47%) or 3544 (48%).
Owners of other residential properties
One in five (20%) of Australian households (1.86 million households) owned a residential property other than their usual residence in 201718. These properties include those that are being rented out as residential investment properties and those used for other purposes, such as holiday homes.
- 71% owned a single property additional to their own home
- 5% owned four or more properties
- Almost four in ten households (37%) were in the highest quintile of equivalised disposable household income.
Clients of the Parliamentary Library can request assistance to interpret the statistics or find other relevant data by contacting the Parliamentary Library.
Source:Australian Bureau of Statistics,Housing Occupancy and Costs, 2017-18, cat no. 4130.0
Joanne Simon-Davies is a researcher in the Australian Parliamentary Library.
