Coronavirus data prove Australia is in Asia
May 25, 2020
Cross-jurisdiction comparisons are notoriously difficult and it’s almost impossible to prove lockdowns have saved lives, except by falling back tautologically on the epidemiological model’s own projections of mortality figures with no lockdown.
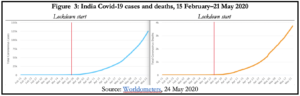
Yet, in most cases countries with different lockdown strategies show broadly similar coronavirus curves that reached its inflection point before lockdown measures began to affect it. Yinon Weiss, writing for RealClearPolitics (21 May), has a sharp and succinct summary of the Covid-19 story thus far:
In the face of a novel virus threat, China clamped down on its citizens. Academics used faulty information to build faulty models. Leaders relied on these faulty models. Dissenting views were suppressed. The media flamed fears and the world panicked.
That is the story of what may eventually be known as one of the biggest medical and economic blunders of all time. The collective failure of every Western nation, except one, to question groupthink will surely be studied by economists, doctors, and psychologists for decades to come.
A Bloomberg article by Elaine He (20 May) crunched data from 17 European countries from 1 January to 15 May, looking at severity of restrictions and dates when they were implemented. According to her analysis, ‘the data show that the relative strictness of a country’s containment measures had little bearing on [success] … in containing the virus’. More important than the stringency of the measures is their timing and manner of implementation, with early preparation and adequate healthcare resources being especially critical.
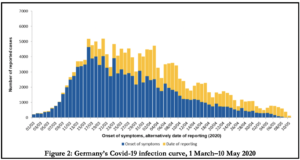
‘R’ is defined as the mean number of people cross-infected by one case. It is the magic number informing all epidemiological models of the likely progression of the virus under different scenarios and how to keep it below 1, the threshold at which infections grow in the overall population. A good example of the R number falling below 1 before a lockdown was imposed and staying so throughout comes from Germany. This chart from the Robert Koch Institute shows that by 23 March, when the most severe lockdown measures were imposed, R was already below 1 and in the following weeks did not decline any further (Figure 2). That is, the lockdown made no appreciable difference to R.
No doubt the scientific explanation will come in due course. As a generalisation, it would appear that seasonal flu tends to be more lethal per infection in developing countries that do not have prophylactic vaccination programs, while Covid-19 has been deadlier in the developed world because of the greater cohort of elderly people already afflicted with other serious ailments.
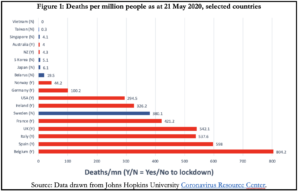
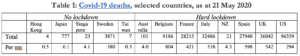
Meanwhile the statistics point to an interesting geographical counterpoint to a long-standing geopolitical discourse about Australia’s national identity. Based on our low number of infections and deaths, we quite clearly belong to Asia rather than the North Atlantic community. Or deaths stand at 4.0 per million people. But when put into the Asian context, this is not quite so impressive as the politicians would have us believe, which is also the narrative that journalists seem mostly to have bought hook, line and sinker. Against Asian benchmarks, with lockdowns Australia and New Zealand are at the higher end of the spectrum despite the reality that very few of our Asian neighbours locked down their countries (Table 1).
More on this later, but for now let’s note another critical point of relevance. We have the massive advantages of being an island country well distant from the China-based origins of the virus, vast open spaces, sunshine as the best disinfectant, largely single family dwellings, low reliance on mass transit, etc. And unlike in the northern hemisphere where the pandemic’s full fury struck mid-winter at the height of the flu season, it arrived in Australia in the latter part of summer. By contrast Taiwan, which lies just 130km offshore from China, has 1.2mn people living or working there, and 3–4mn travel between the two territories annually. Vietnam too shares a border with China yet, as of 20 May, quite remarkably it had not recorded a single death from Covid-19. It’s worth reflecting for a few minutes on the relative geographical, seasonal, demographic and housing circumstance of Australia and Hong Kong. The comparison puts Australia’s sense of triumphalism into perspective.
Countries with lockdowns also face an exit trap of their own making. Having rejected a herd immunity strategy in favour of suppression and elimination, how long will they remain shut down, especially as a vaccine may never become available? Little wonder that governments are extremely nervous about being swamped with second and third waves of infections as they cautiously open up.
On 18 May, I received a mass email invitation from the managing editor of the journal Perspectives on Politics that began: ‘In late April 2020, declared US fatalities from Covid-19 exceeded American battlefield deaths in the war in Vietnam’. It was a call for papers for a special issue on ‘Pandemic Politics’. Now let’s put this in perspective. The Centers for Disease Control (CDC) writes thus about the 2017–18 flu season in the US:
… the burden of illness during the 2017–2018 season was high with an estimated 45 million [11mn children, 28mn 18–64 working age, and 6mn adults aged 65 and older] people getting sick with influenza, 21 million people going to a health care provider, 810,000 hospitalizations, and 61,000 deaths from influenza.
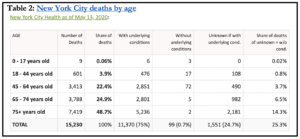
Thus the 2017–18 flu season took more US lives than 18 years of Vietnam, but of course was never reported as such. How could the US media have missed such a big story? Meanwhile, Covid-19 as at 20 May: global confirmed cases 5mn, deaths 328,000; US deaths 93,439 (New York, 28,636; New Jersey 10,749). For most people, Covid-19 is not dangerous; only for the age-stratified with serious comorbidities. Covid mortality for people under 50 is tiny (Table 2). A fit and healthy person under 50 has a 99.9% chance of survival.
The government… implements draconian measures. The constituents look at the draconian measures and become even more hysterical. They feed each other and the snowball becomes larger and larger until you reach irrational territory. This is nothing more than a flu epidemic if you care to look at the numbers and the data.
Some day there will have to be a full Royal Commission into the modelling and the national responses to complement the distracting (deliberately so?) obsession with a global inquiry into the origins and spread of the virus from China to the rest of the world.