The rise and fall of coronavirus modelling
May 27, 2020
Will the Great Lockdown’s epitaph be ‘ The Greatest Mistake in History_’?_
The average seasonal flu has a fatality rate of 0.1%. On 5 March, based on the early data from Wuhan in China which had the first cluster of infections and deaths, the World Health Organisation (WHO) published a fatality rate of 3.4% for the novel coronavirus. Not surprisingly, this alarmed public health authorities everywhere but it also badly misled epidemiologists in their modelling of the likely infectiousness and lethality of the virus under different response scenarios.
By now we have better and more reliable data. A report from the US Centers for Disease Control and Prevention (CDC) on 20 May estimated the most likely case fatality rate (CFR or the percentage of known infected cases who die from the disease) of 0.4%. Its estimate of asymptomatic cases is 35%, giving an overall infection fatality rate (IFR) of 0.26%. The president of the Yamaneko Research Institute writes that the fatality rate in Tokyo is also 0.26%.
The Imperial College London (ICL) model of 16 March predicted up to 510,000 UK and 2.2mn US deaths in ‘an unmitigated epidemic’ (p. 7). The model’s assumption was that without intervention, 80% of the people would be infected and the IFR was 1%. On this basis 500,000 is the figure the model came up with in its ‘reasonable worst-case scenario’ (which is an oxymoron). In a subsequent interview Ferguson revised this to ‘ the most likely scenario’. ‘But as information has been gathered in recent weeks, from particularly Italy but other countries, it has become increasingly clear that actually this is not the reasonable worst case – it is the most likely scenario’, he said. The ICL model has been proven just as spectacularly wrong in its best case scenario of a maximum of 20,000 deaths over two years with school and university closures, case isolation and social distancing, going down to 15,000 with home quarantine thrown into the mix as well (p. 14).
The seductive numerical precision of the ICL model provoked a herd-like panic across the world with its grim forecasts of tens of millions dead. Yet, it was undermined by data collected in the following weeks that progressively reduced its policy usefulness. ICL ignored best practice to release the codes behind their model late and reluctantly. Chris von Csefalvay, an epidemiological specialist in the virology of bat-borne illnesses, including coronviruses, examined the code and concluded its flaws fall ‘somewhere between negligence and… grave scientific misconduct’. Drawing on data from the early outbreaks in Wuhan and Italy, the model made critically flawed assumptions on infectiousness and lethality that led it to massively overstate the mortality risks. Professor John Ioannidis of Stanford University’s School of Medicine dismissed the coronavirus data as ‘ utterly unreliable’ and dubbed the ICL model ‘ speculation and science fiction’.
Michael Levitt from the same School won the 2013 Chemistry Nobel Prize for ‘the development of multiscale models for complex chemical systems’. Although not an epidemiologist, presumably he knows something about complex modelling. He argues the growth of coronavirus infections is never exponential ‘forever’. Although the growth rate is very rapid at first, it also decreases at an exponential rate. He therefore describes the coronavirus infection curve as ‘ self-flattening’. The mortality plateaus around one month of natural deaths, not one year as Ferguson had projected.
Levitt’s argument mirrors that of Sunetra Gupta, Professor of Theoretical Epidemiology at the University of Oxford. Her team produced a competing, far more sceptical model to that of ICL back in March that has stood the test of time a lot better. In an interview with UnHerd TV on 21 May, she believes many people who have been exposed to the virus likely have other kinds of pre-existing immunities to related coronaviruses such as the common cold. According to her, the strikingly similar patterns of the epidemic across countries is better explained by this hidden immunity than by lockdowns or government interventions:
In almost every context we’ve seen the epidemic grow, turn around and die away — almost like clockwork. Different countries have had different lockdown policies, and yet what we’ve observed is almost a uniform pattern of behaviour which is highly consistent with [our] model. To me that suggests that … the build-up of immunity … [is] a more parsimonious explanation than one which requires in every country for lockdown … to have had the same effect.
Conversely, a prolonged lockdown increases ‘the vulnerability of the entire population to new pathogens’.
That said, I’d be curious to know what Professors Levitt and Gupta make of the India case, as discussed in my previous article on Monday, where cases and deaths have not ‘self-flattened’ but are still rising more than two months later.
Among other contenders, the US lockdown intervention strategy may have its origins in a high school science experiment by a 14-year old girl named Laura Glass whose father worked as a complex-systems analyst with the Sandia National Laboratories. When the strategy of quarantine-cum-forced separation made its way into the policy bureaucracy in 2006–07 at President George W. Bush’s request to look for ways to deal with the next pandemic, it was rejected with the recommendation that the measure should be eliminated from serious consideration. Instead, a pandemic should be allowed to spread, people falling sick should be treated, and a vaccine developed to prevent it from coming back.
There are two striking European examples to date of observational data that contradict the dominant epidemiological model on which the lockdowns have been based. Belarus has been ruled by a dictator since 1994. President Alexander Lukashenko has dismissed Covid-19 panic as a ‘ psychosis‘, rejected lockdown and social distancing measures, and refused to close schools and cancel football matches. On 1 April, a WHO official warned it was entering a ‘concerning’ new phase and urged the imposition of new measures to control the infection but was rebuffed. By 22 May, Belarus had just 190 Covid-19 deaths.
In two complementary articles for _The_ _Mail on Sunday_ on 3 May and then _The Sunday Times_ two weeks later, Lord Sumption, retired judge of the UK Supreme Court, made two important observations:
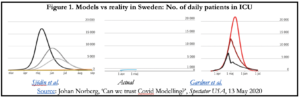
- The original justification for the lockdown was to save the National Health System (NHS) by averting the ICU capacity from being overwhelmed by ‘flattening the curve’. The policy does not reduce the number of cases but spreads them more slowly so the health system can cope. In the event the nation’s hospital system never approached peak capacity. The infections peaked around 10 April, at which time only 60% of ICU beds were occupied;
- When the initial lockdown period ended, it was extended on an entirely new rationale: suppression or elimination of the virus. However, the rhetoric of second wave of infections seems to be an invention to justify a policy that politicians have become too invested in and are afraid of reversing. Lockdowns are continuing, that is, to protect ‘politicians’ backs. They are not wicked men, just timid ones… But it is a wicked thing that they are doing’.
It’s ironic that new pharmaceutical products must undergo rigorous testing for side-effects and collateral harm before being approved for public use, but lockdowns were mimicked by one country after another with little apparent consideration of the unintended and perverse health, economic, educational and other human consequences.
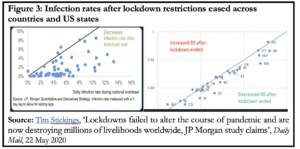
By now we also have some preliminary data from jurisdictions that have eased lockdown restrictions to varying degrees. Figure 3 is from a study by JP Morgan of the impact of countries and US states easing various lockdown measures. In both charts, what is immediately striking is that ‘R’ has mostly gone down, not up, suggesting that the virus might evolve according to its own internal logic.
It will be a year or two, perhaps more, before we know how many lives Covid-19 took in individual countries and worldwide, how many lives were saved by lockdowns, and how many were killed indirectly from the unintended, perverse and long-term consequences of the lockdowns.