Sunday environmental round up, 13 September 2020
September 13, 2020
Per head of population Australians produce a lot of greenhouse gases but with the right support household consumption and emissions can be reduced. Unfortunately, governments are currently more enthusiastic about subsidising fossil fuels. Shipping’s emissions continue to rise. The USA’s emissions in four charts.
Household consumption produces around two-thirds of global greenhouse gas (GHG) emissions. A systematic literature review has examined the entire life cycles and the global supply chains of 60 things we use and do in our daily lives to identify the most promising emission reduction potentials of climate-friendly consumption options. The focus was on transport, food and housing. Not surprisingly the researchers found that there are lots of existing ways that the majority of household GHG footprints can be substantially reduced. The big-ticket emission savers were going car-free or using an electric vehicle (reduction of approximately 2 tons of CO2-equivalent per person per year), making one fewer long haul flight a year (1.7 tons), using public transport (1 ton), purchasing or producing your own renewable electricity at home (1.6 tons), energy efficient home construction and equipment (0.9 tons), installing a heat pump (0.8 tons), and being vegan (0.8 tons). As you can see, transport has excellent emissions reduction potential. The researchers are at pains to point out that these changes cannot be delegated solely to individuals. Household consumption changes will not happen without governments and organisations tackling the infrastructural, institutional and behavioural lock-ins that encourage, initiate and reinforce patterns of consumption that produce lots of GHGs. Low emissions options must be made easier to adopt as well as more desirable.
To put those emissions reduction figures into a very rough context, in 2018 the global emissions average was approximately 6 tons of CO2-equivalent per person per year. Australians and Americans (i.e. USA residents) emitted approximately 16 tons per person per year, Chinese 7 tons and Indians 2 tons. About 60 countries emitted more than the global average per person and about the same number emitted less than 1 ton per person per year. Wealthy individuals can emit 50+ tons per year. To stay under 1.5oC, we need to get the global average down to around 3 tons per person per year, which is more than the current average of about 100 countries.
A study by the International Renewable Energy Agency (IRENA) reveals that in 2017 the world’s governments provided the fossil fuel industry with subsidies worth US$3.1 trillion, almost twenty times more than was provided to renewable energy. Direct fossil fuel subsidies amounted to US$447 billion (half of it to petroleum products and just over a quarter related to electricity generation). The biggest direct subsidisers were Iran, Saudi Arabia and China – about US$50 billion/year each – with Russia close behind. However, much much larger was the cost of indirect subsidies - the costs borne by governments and the community to deal with the damage done by fossil fuels to the environment and people’s health. These costs are not paid by the industry and hence not included in the price of the product. Air pollution was the major ‘unpriced externality’, costing US$2.3 trillion globally (and causing much human suffering). Rebalancing of energy subsidies away from fossil fuels could substantially reduce the total annual bill to US$475 billion by 2050. This is, of course, not the first study to examine this issue and the figures vary somewhat depending on the time period and what’s in and what’s out. But the messages are always the same: fossil fuels only seem cheap because the prices to the consumer do not include the true costs; governments are propping up the fossil fuel industry with massive handouts and favourable policies; fossil fuel subsidies are vastly greater than renewable energy subsidies; massive financial savings can be made by rapidly reducing fossil fuel subsidies, with immense and rapid benefits for the environment and human health.
Shipping and aviation both produce a lot of greenhouse gases (approximately 3% of the global total each, more for aviation if you include water vapour) and both are recognised as sectors that will be hard to decarbonise. Many ships burn the dirtiest of petroleum products, bunker fuel, that also produces copious other air pollutants. Both industries have developed (not very ambitious) plans to reduce their emissions in coming decades. Despite the plan, shipping’s greenhouse gas emissions continue to rise as increases in marine traffic outpace gains in efficiency, and emissions are projected to be 30% higher by 2050. While bunker fuel is being phased out slowly, it’s being replaced with natural gas which results in the release of lots of unburnt methane. Not much environmental benefit there. The Paris Agreement is sinking faster than the Titanic.
Finally, four figures that tell an interesting story about the USA’s emissions and power.
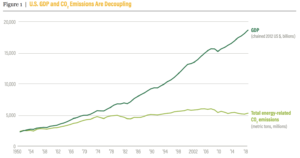
1 We may think of the USA as the bad boy of climate change mitigation but, credit where it’s due, their energy-related CO2 emissions peaked as long ago as 2008 and have been declining slowly since, even while GDP has continued to grow.
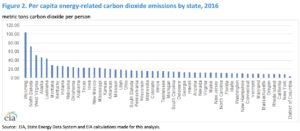
2 That said, the individual states vary enormously in their carbon footprint. For instance, per capita energy-related CO2 emissions vary between 104 tons per year in Wyoming to less than 5 tons per year in several states and the District of Columbia.
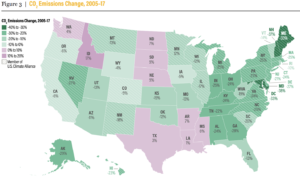
3 Looking at the change in CO2 emissions between 2005 and 2017, four jurisdictions (top marks to Maryland) have reduced their emissions by over 30% while several states have increased their emissions, Idaho taking the wooden spoon with an increase of 17%. States to the east of a line from New Orleans to Chicago are performing best.
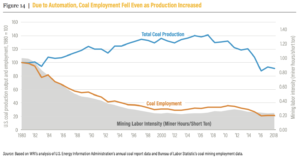
4 Finally, Making Coal Great Again – Trump’s rallying call. Total coal production peaked in the USA around 2007 and has fallen steadily since – to about 65% of the peak by 2018. But look at employment in coal production. Numbers fell about 70% between 1980 and the early 2000s. By 2018 the coal industry employed only about 20% of the people it employed in 1980. Most of the workforce reduction was prompted by automation between 1980 and the early 2000s when production was increasing. It takes about a fifth as many miners to produce a ton of coal now as it did in 1980. So much for mining companies looking after their communities.