Sunday environmental round up.
May 16, 2021
Energy use is soaring in 2021 after COVID reduced demand in 2020. Renewables are approaching take-off in the USA, while the Australian government continues to load them with ballast. Call for health care services globally to reduce their large carbon footprint.
The International Energy Agency (IEA) has published its annual Global Energy Review for 2021. The main findings include:
- COVID had massive effects on global markets and energy use in 2020 and this will continue in 2021;
- Global energy demand will increase by 4.6% in 2021, 0.5% above the 2019 level;
- Demand for fossil fuels will increase in 2021, resulting in the second largest annual increase in energy-related CO2 emissions;
- Global coal demand will increase by 4.5% in 2021 (mostly in Asia) and approach the 2014 peak;
- Natural gas demand will increase by 3.2% in 2021, mostly in Asia, the Middle East and Russia;
- Electricity growth will be its fastest in over 10 years, an increase of 4.5% compared with 2020 – almost 5 times greater than 2020’s decline;
- Demand for oil for road and air transport will continue to be sluggish;
- Demand for renewables grew by 3% in 2020 and will provide over half of the increase in global electricity supply in 2021, half of this in China.
Points 2, 3, 6 and 8 are the crucial ones. Note particularly that renewables will provide over half of the massive increase in global electricity supply in 2021. The corollary being that the use of fossil fuels to generate electricity will also increase markedly. The continuing problem is that renewables are supplementing fossil fuels, not replacing them.
Down to Earth, an online Indian news service that aspires to ‘prepare readers to change the world’, has produced a rather gothic 3-minute video of the IEA’s findings. Their bottom line captures the good news and the bad: economic activity is rebounding around the world; so are emissions.
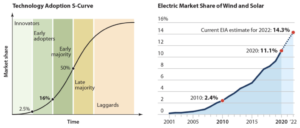
Better news from the USA is that wind and utility-scale solar have been gaining market share for over twenty years. They now produce 11% of electricity and this is expected to increase to over 14% in 2022. This is encouragingly close to the 16% of market share at which disruptive technologies really take off – see graphs below. Over the next decade, American electricity companies will bring increasing amounts of solar and wind generated power online while their plans to close coal-fired power stations are increasing annually. No wonder when existing coal-fired stations are operating at 40% capacity.
On the other hand, the Australian government is doing all it can to slow down the adoption of renewable energy. I’m sure that many of you read Renew Economy. For those who don’t, I strongly recommend watching Giles Parkinson’s short video comparing batteries and bananas … briefly explaining some of the many advantages that household and ‘big’ batteries provide to individual users and the electricity grid as a whole. Giles’s main point is that batteries are changing the way the grid works and that the rules governing electricity generation and distribution, and the way service providers are remunerated, need to be changed to take this into account if we want an efficient, reliable, affordable, 21st century power system. Australia’s current rules and some of the proposed changes are mainly designed to prop up the inefficient, increasingly unreliable, dirty, health-damaging, dying 20th century coal and gas industries.
The bottom line, however, is that is doesn’t matter how much renewable energy we install and use unless we reduce and rapidly eliminate the burning of fossil fuels. Until we stop pumping out greenhouse gases, their concentration in the atmosphere will continue to rise and global warming will keep increasing.
In the word association game, ‘COVID’ might well be followed by ‘illness’ and ‘fossil fuels’ might be followed by ‘greenhouse gases’ – and who could argue? But ‘climate change’ might equally be followed by ‘illness’ and ‘health care’ by ‘greenhouse gases’. Why? First, climate change is already a significant cause of illness, injury and premature death, and this is bound to increase as global warming increases. Second, health care systems are significant emitters of greenhouse gases. So, according to the recently published ‘Global Road Map for Health Care Decarbonization’, the climate crisis is a health crisis and if the world’s health care services were a single country they’d be the fifth largest emitter on the planet – responsible for about 4.4% of global emissions, and growing. It seems contradictory that a service that is devoted to promoting health, preventing illness and saving lives should itself be a significant contributor to the greatest threat to health during the 21st century.
Fossil fuel use is, of course, the major contributor to health care’s greenhouse gas emissions but, contrary to expectations, power for hospitals and transport are responsible for only 20-30% of the sector’s emissions. More than 70% of emissions are caused by the drugs, equipment, food and other materials that health services purchase and use to deliver health care. The good news is that solutions exist and health services can be made carbon neutral. Even better, the solutions often deliver a quadruple benefit: fewer emissions, better health care, better health and better value for money. The Road Map’s suggestions for decarbonizing health care facilities, services and supply chains include:
- Power health care with 100% ‘healthy’ renewable energy
- Ensure buildings, infrastructure, transport and travel become zero greenhouse gas emitters
- Provide healthy, sustainable, locally grown food
- Produce low carbon pharmaceuticals
- Reduce health care waste, including drug waste (a major contributor to drugs’ high carbon footprint)
- Improve the efficiency of health systems and eliminate useless tests and treatment.
In addition, the report notes the enormous potential of health systems and health professionals to demonstrate leadership and advocacy for decarbonizing the wider economy and society.
Finally, the Road Map includes profiles of the climate footprints of the health services in 68 countries. Australia’s health system is responsible for 5-7% of Australia’s total emissions, and we rank 12th of the 68 in total health care emissions and 3rd in per capita health care emissions. No surprises there.
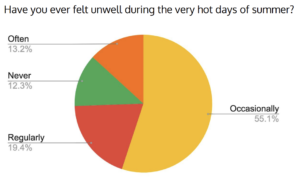
Responding to the effect of global warming on people’s health, Sweltering Cities is an initiative in Western Sydney that works with communities ‘impacted by extreme heat to secure, cooler, more equitable and sustainable cities, with planning and policy that puts people at the centre’. In early 2021 they conducted a survey of 682 people in 168 postcodes in Western Sydney to map the impacts of heat on people. The pie chart below demonstrates that approximately a third of people regularly or often feel unwell during very hot summer days. This is while global warming is still averaging only just over 1oC globally. It’s going to get a whole lot hotter in the next couple of decades, especially in our cities.
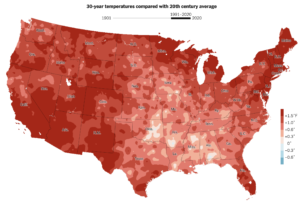
The map below shows the average temperatures across the contiguous USA for 1991-2020 compared with the 20th century average. Not many cooler areas. The link provides a further link to an animation that shows the change every 30 years during the 20th century. There are also maps for precipitation which is a lot more variable.