9 May 2025
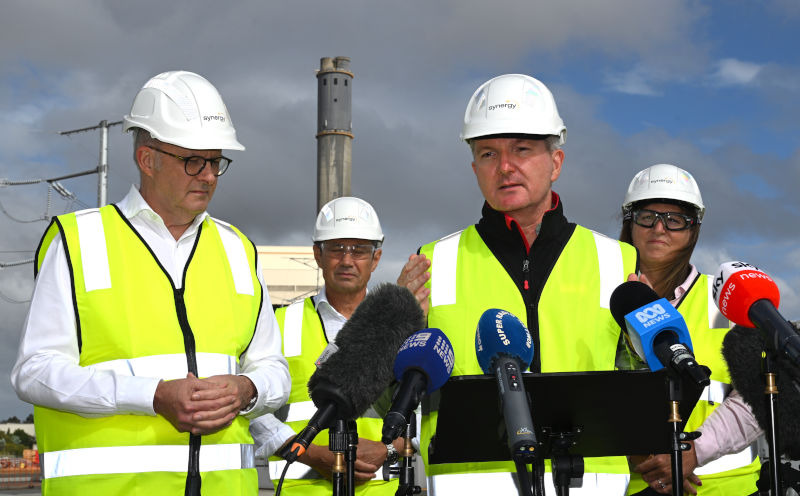
Labor says its second term will be about productivity reform. These ideas could help shift the dial economy, politics
In his victory speech, Prime Minister Anthony Albanese highlighted social policy as a major factor in Labor’s electoral success, particularly Medicare, housing and cost-of-living relief. He was justified in doing so.

9 May 2025
The climate won’t change for the Liberals without more women and fewer oldies
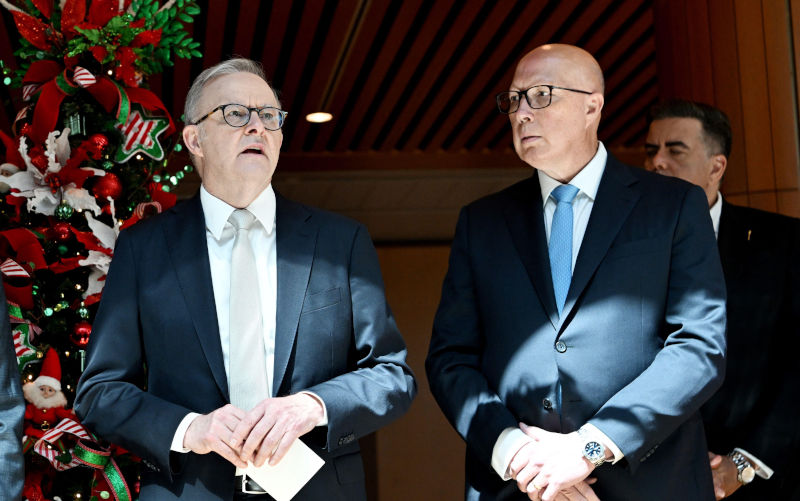
If the Liberals have any sense, they won’t waste too much time blaming their shocking election result on Peter Dutton, Donald Trump, Cyclone Alfred, the party secretariat, an unready shadow ministry or any other “proximate cause”, as economists say. Why not? Because none of these go to the heart of their party’s problem.

9 May 2025
Aid to Gaza: Moral and political dilemmas for Australia
Amidst preparations for a renewed assault intended to allow permanent Israeli occupation of Gaza, Israel and the United States are also about to establish a mechanism through which humanitarian aid will henceforth be distributed exclusively by private firms protected by the Israeli military.

Israel's war against Gaza
Media coverage of the war in Gaza since October 2023 has spread a series of lies propagated by Israel and the United States. This publication presents information, analysis, clarification, views and perspectives largely unavailable in mainstream media in Australia and elsewhere.
Download the PDF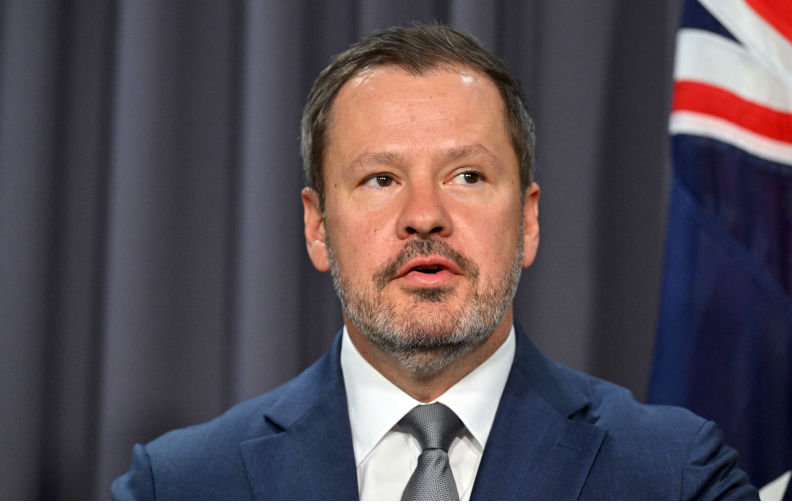
9 May 2025
Exclusion of Ed Husic from the Albanese Ministry Statement
A showing of poor judgment, unfairness and diminished respect for the contribution of others.

9 May 2025
India and Pakistan have fought many wars in the past. Are we on the precipice of a new one?
India conducted military strikes against Pakistan overnight, hitting numerous sites in Pakistan-controlled Kashmir and deeper into Pakistan itself. Security officials say precision strike weapon systems, including drones, were used.

9 May 2025
Danger: Global security is now in the hands of Trump, Rubio and Hegseth
The United States is a national security state. Over the past half-century, it has unnecessarily conducted “forever wars” in Vietnam (1960s-1970s), Iraq (2000s-the present), Afghanistan (2000s-2020), and now possibly in Yemen.

9 May 2025
Re-elected Albanese Govt must condemn Israel's brutality and cut ties
On 5 May, the Israeli Parliament approved plans to annex and occupy Gaza. These plans have been discussed for months. This is a blatant mission to ethnically cleanse Gaza, advancing Israel’s colonial intentions to take over the territory and rid it of Palestinians.

9 May 2025
Zionist lawfare comes for Australian journalist
The Zionist federation of Australia should be recognised as a duplicitous and malicious actor in Australian society and politics.
9 May 2025
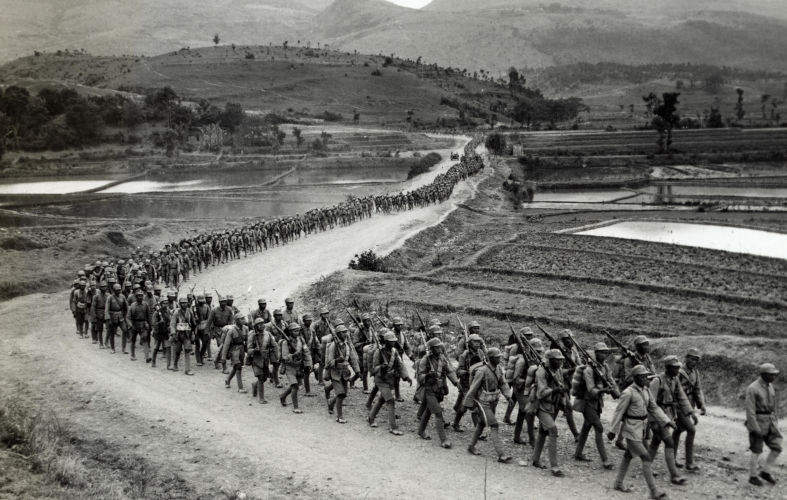
Four World War II myths: Ignoring China, downplaying Russia’s role
As the 80th anniversary of the end of World War II approaches in 2025, the vital contributions of China and Russia remain largely overlooked by the West, just as they have always been.

9 May 2025
The steady-state economy: Why we need it and how it could be progressed
A common factor underlying several of Australia’s major problems — housing, inadequate public transport, slow response to the climate crisis, loss of biodiversity, water shortage, pollution and deforestation — is the growth in consumption. Yet it is receiving negligible attention from the government and Opposition.

8 May 2025
An economic reform agenda for Labor
The recent election was won by looking ahead. But a better economic future requires an economic reform agenda, and getting agreement will not be easy. However, there are encouraging signs that the government is up to the task.
Latest on Palestine and Israel

9 May 2025
Aid to Gaza: Moral and political dilemmas for Australia
Amidst preparations for a renewed assault intended to allow permanent Israeli occupation of Gaza, Israel and the United States are also about to establish a mechanism through which humanitarian aid will henceforth be distributed exclusively by private firms protected by the Israeli military.

9 May 2025
Re-elected Albanese Govt must condemn Israel's brutality and cut ties
On 5 May, the Israeli Parliament approved plans to annex and occupy Gaza. These plans have been discussed for months. This is a blatant mission to ethnically cleanse Gaza, advancing Israel’s colonial intentions to take over the territory and rid it of Palestinians.

9 May 2025
Zionist lawfare comes for Australian journalist
The Zionist federation of Australia should be recognised as a duplicitous and malicious actor in Australian society and politics.

8 May 2025
Mainstream media and distorted Palestine reporting
Australia’s mainstream media have ignored and distorted the genocide in Palestine. A recent Australians for Humanity forum, chaired by former SBS newsreader Mary Kostakidis, and featuring Margaret Reynolds, Stuart Rees and Peter Slezak, tackled the issues and discussed what needs to be done.

7 May 2025
Judaism and Zionism are not the same
No doubt about it. We live in a topsy-turvy world. How Kafkaesque can it get, when some of Zionism’s most fervent supporters have been politicians like Scott Morrison, Peter Dutton or — God help us — the Mad King of Mar-a-Lago?

7 May 2025
'Genocide in action' as 60-day blockade plunges Gaza into mass starvation
The two-month-long siege is a clear and calculated effort to collectively punish over two million civilians and to make Gaza unliveable.

7 May 2025
UN chief 'alarmed' by Israel's Gaza conquest plan – but minister says no concerns from Trump
I don't feel that there is pressure on us from Trump and his administration, said Ze'ev Eklin. They understand exactly what is happening here.

5 May 2025
Andrew Bolt's cynical attack on faith
On Sky News (22 April), Andrew Bolt credited Anthony Albanese with a brilliant, if devious, election ploy.

Support our independent media with your donation
Pearls and Irritations leads the way in raising and analysing vital issues often neglected in mainstream media. Your contribution supports our independence and quality commentary on matters importance to Australia and our region.
DonateLatest on China

9 May 2025
Four World War II myths: Ignoring China, downplaying Russia’s role china, defence, politics, world
As the 80th anniversary of the end of World War II approaches in 2025, the vital contributions of China and Russia remain largely overlooked by the West, just as they have always been.

8 May 2025
Trump shoves Indonesia into China's hands
Jakarta is not a charmer, but her assets are attractive. Beijing and Washington have long been wooing the Indonesian capital for her strategic power and influence.

7 May 2025
Who’s afraid of big, bad China?
Be afraid, be very afraid. But not of China. To the contrary, the proper management of co-operative relations with China is essential to Australia’s future.
More from Pearls and Irritations
Latest letters to the editor
The leopard can’t change its spots
Fiona Colin — Melbourne
Essential clarity from Sara Dowse
Stephanie Dowrick — Darwin 0800, NT
Tim Beal's articles in need of corrections
Craig Thomas — North Sydney
Will the election deliver good governance?
Alyssa Aleksanian — Hazelbrook
