11 May 2025
The New Pope – Leo XIV politics, religion, world
I thought it might be third time lucky, but I was wrong again. I backed the wrong horse as pope!

11 May 2025
Dutton’s election campaign rout lets RBA off the hook
Reserve Bank governor Michele Bullock must be breathing a quiet sigh of relief now the Albanese Government has been triumphantly returned to office. If you can’t think why she should be relieved, you’re helping make my point.

11 May 2025
In the age of the influencer, does the political backing of News Corp matter anymore?
This year’s federal election demonstrated that Australia’s media landscape has changed. Big players are no longer “kingmakers” in politics.

Israel's war against Gaza
Media coverage of the war in Gaza since October 2023 has spread a series of lies propagated by Israel and the United States. This publication presents information, analysis, clarification, views and perspectives largely unavailable in mainstream media in Australia and elsewhere.
Download the PDF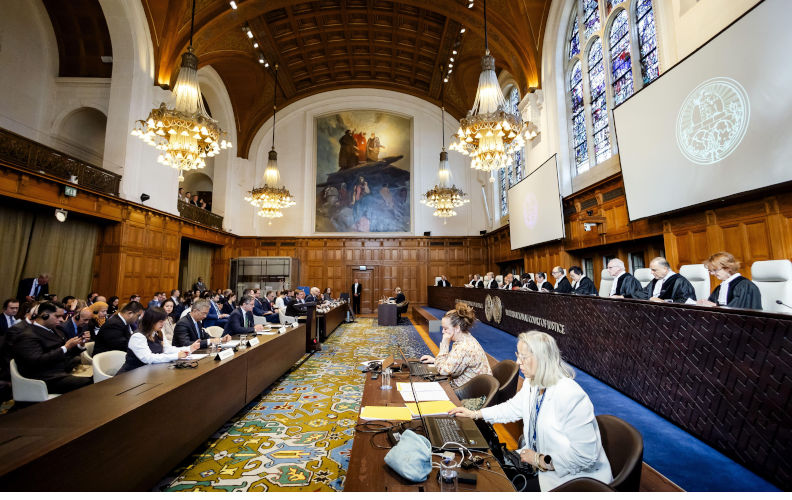
11 May 2025
At the ICJ, only US and Hungary back Israel starving Gaza
Thirty-seven states, the UN and international NGOs all condemned Israel’s denial of aid to the starving people of Gaza at the International Court of Justice in the first week of May.

11 May 2025
Environment: Will Labor now protect our environment? If not now, probably never
The world is getting hotter, seas are rising more quickly, oceans are heating faster and freshwater is getting saltier, but Labor’s first-term environmental performance provides little optimism for its second, even though Australia leads the way with solar energy generation.
10 May 2025
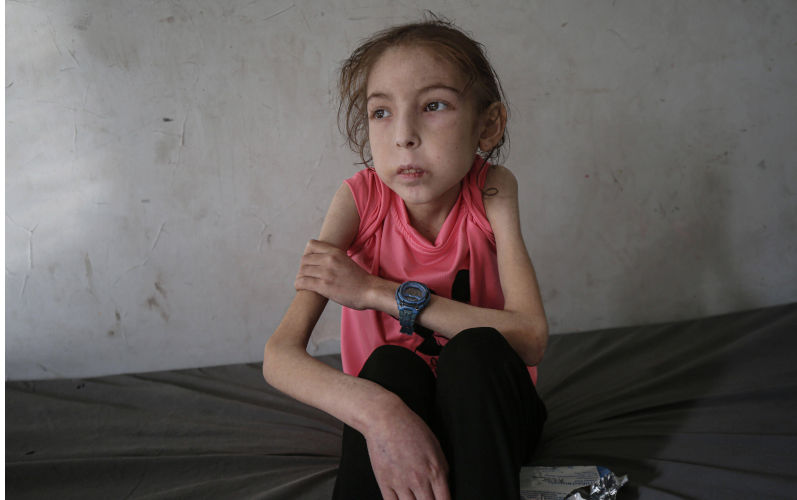
'This isn't me': Israeli war and healthcare collapse leave Gaza child unrecognisable
Under a tightening Israeli siege, Palestinian girl Rahaf Ayyad struggles with physical and emotional changes, as her mother fights for answers.
10 May 2025
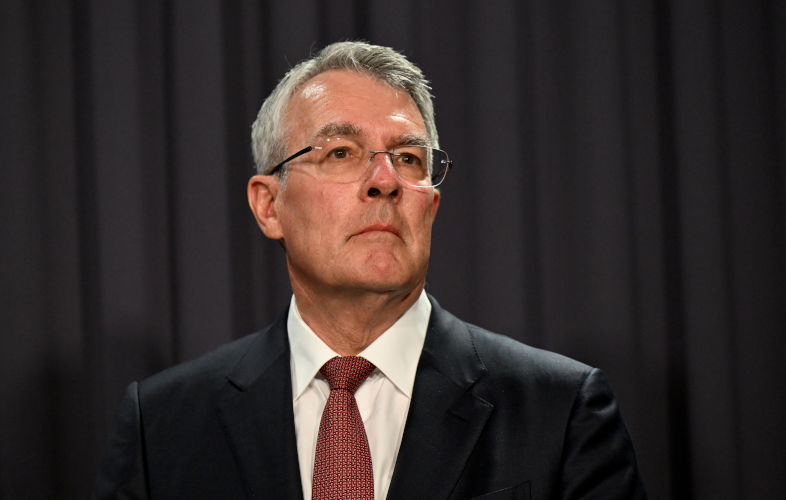
Dreyfus leaves little legacy
In his term as attorney-general, Mark Dreyfus failed to address many big issues.

10 May 2025
New pope faces limits on changes he can make to the Church
Cardinal Robert Prevost of the United States has been picked to be the new leader of the Roman Catholic Church; he will be known as Pope Leo XIV.

10 May 2025
'Escalation risks catastrophe': Restraint urged as Pakistan hits back after Indian strikes
An armed conflict between India and Pakistan would be catastrophic for the world and must be avoided at all costs, US Congresswoman Ilhan Omar has warned.

10 May 2025
China touts new law as foundation for private sector growth
A week after the passage of a law on China’s private economy, officials said the bill would unleash the potential of the non-state sector.
10 May 2025
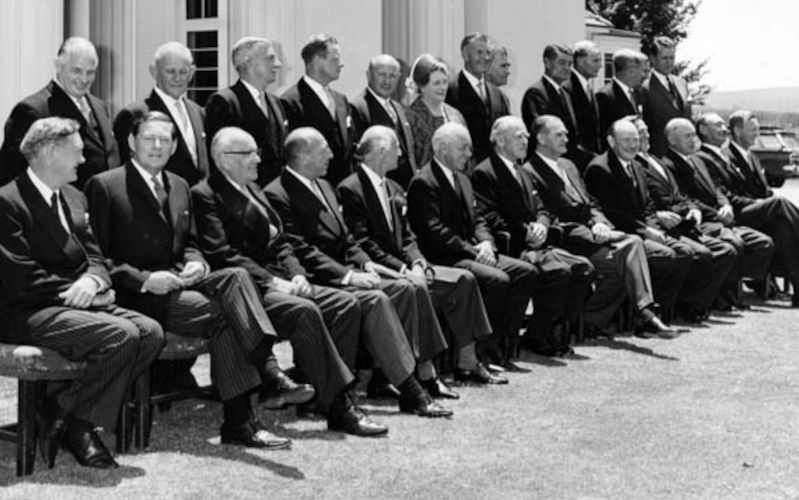
The Racial Discrimination Act at 50
The passage 50 years ago of the Racial Discrimination Act, Australia’s first substantial piece of human rights legislation, laid the basis for the recognition of native title in the common law in the 1990s.
Latest on Palestine and Israel

11 May 2025
At the ICJ, only US and Hungary back Israel starving Gaza
Thirty-seven states, the UN and international NGOs all condemned Israel’s denial of aid to the starving people of Gaza at the International Court of Justice in the first week of May.

10 May 2025
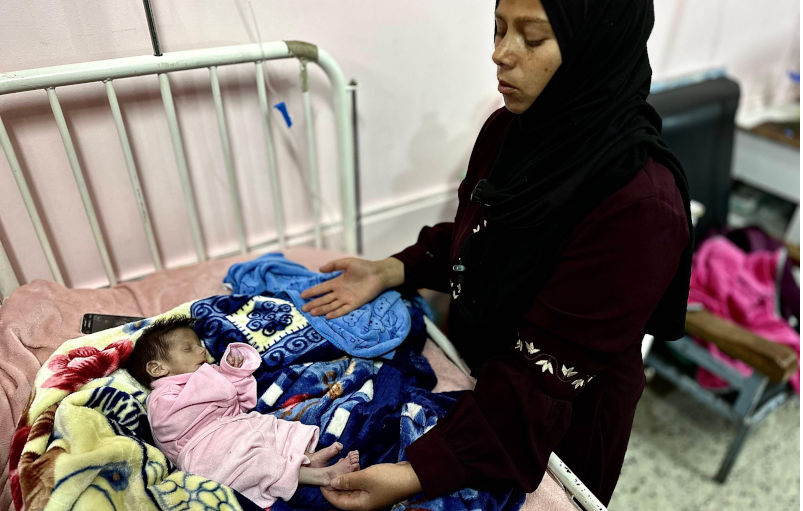
'This isn't me': Israeli war and healthcare collapse leave Gaza child unrecognisable
Under a tightening Israeli siege, Palestinian girl Rahaf Ayyad struggles with physical and emotional changes, as her mother fights for answers.
9 May 2025
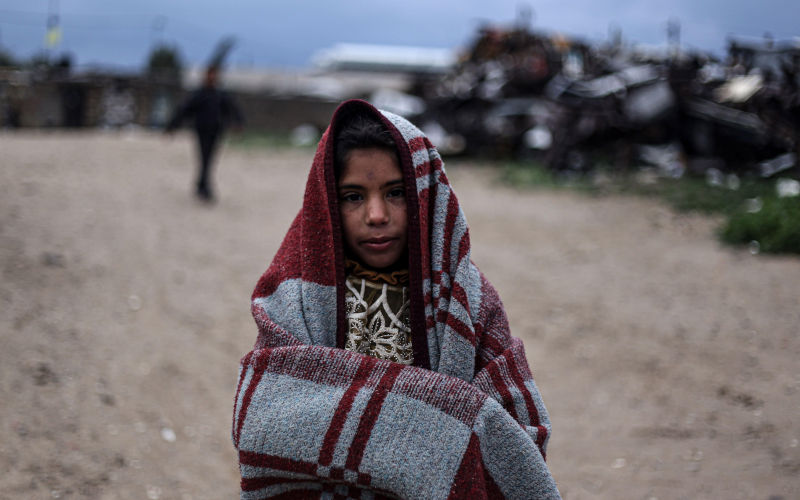
Aid to Gaza: Moral and political dilemmas for Australia
Amidst preparations for a renewed assault intended to allow permanent Israeli occupation of Gaza, Israel and the United States are also about to establish a mechanism through which humanitarian aid will henceforth be distributed exclusively by private firms protected by the Israeli military.
9 May 2025
Re-elected Albanese Govt must condemn Israel's brutality and cut ties
On 5 May, the Israeli Parliament approved plans to annex and occupy Gaza. These plans have been discussed for months. This is a blatant mission to ethnically cleanse Gaza, advancing Israel’s colonial intentions to take over the territory and rid it of Palestinians.

9 May 2025
Zionist lawfare comes for Australian journalist
The Zionist federation of Australia should be recognised as a duplicitous and malicious actor in Australian society and politics.

8 May 2025
Mainstream media and distorted Palestine reporting
Australia’s mainstream media have ignored and distorted the genocide in Palestine. A recent Australians for Humanity forum, chaired by former SBS newsreader Mary Kostakidis, and featuring Margaret Reynolds, Stuart Rees and Peter Slezak, tackled the issues and discussed what needs to be done.

7 May 2025
Judaism and Zionism are not the same
No doubt about it. We live in a topsy-turvy world. How Kafkaesque can it get, when some of Zionism’s most fervent supporters have been politicians like Scott Morrison, Peter Dutton or — God help us — the Mad King of Mar-a-Lago?
7 May 2025
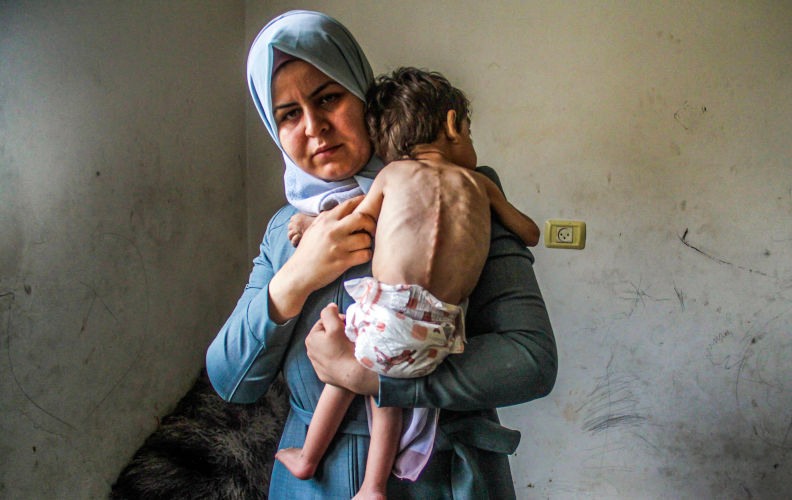
'Genocide in action' as 60-day blockade plunges Gaza into mass starvation
The two-month-long siege is a clear and calculated effort to collectively punish over two million civilians and to make Gaza unliveable.
Support our independent media with your donation
Pearls and Irritations leads the way in raising and analysing vital issues often neglected in mainstream media. Your contribution supports our independence and quality commentary on matters importance to Australia and our region.
DonateLatest on China

10 May 2025
China touts new law as foundation for private sector growth china, economy
A week after the passage of a law on China’s private economy, officials said the bill would unleash the potential of the non-state sector.

9 May 2025
Four World War II myths: Ignoring China, downplaying Russia’s role
As the 80th anniversary of the end of World War II approaches in 2025, the vital contributions of China and Russia remain largely overlooked by the West, just as they have always been.

8 May 2025
Trump shoves Indonesia into China's hands
Jakarta is not a charmer, but her assets are attractive. Beijing and Washington have long been wooing the Indonesian capital for her strategic power and influence.
More from Pearls and Irritations
Latest letters to the editor
Very helpful interpretation of the steady-state economy
Len Puglisi — 1 Balmoral Court Burwood East
The leopard can’t change its spots
Fiona Colin — Melbourne
Essential clarity from Sara Dowse
Stephanie Dowrick — Darwin 0800, NT
Tim Beal's articles in need of corrections
Craig Thomas — North Sydney


