Environment: Governments and fossil fuel subsidies, the infatuation grows
September 16, 2023
Doesnt matter how much harm fossil fuels cause, governments have an Everlasting Love for subsidising them, so no surprise that coal and oil consumption is increasing. The global love affair with electricity started in 1950.
Fossil fuel subsidies keep increasing
According to the International Monetary Fund (IMF), the optimal (or efficient) price of fossil fuels should reflect the full societal costs i.e., their supply costs (labour, raw materials, etc.) and their environmental and social costs (e.g., the CO2 emissions, air pollution, ill health, premature mortality and road congestion associated with their use). Unfortunately, in most countries the prices individuals and companies pay for fossil fuels do not reflect the full costs, particularly not the costs associated with environmental and health damage. In IMF-language, they are sold below the optimal price. This is because, one way or another, governments and/or the public subsidise fossil fuels. Most of the benefits from undercharging for fossil fuels accrue to wealthier households.
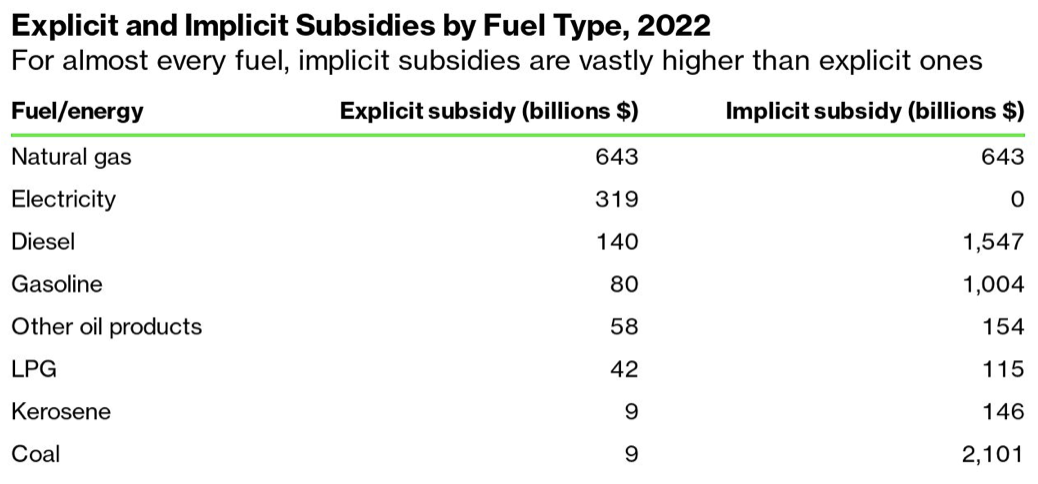
The subsidies provided to fossil fuels fall into two groups. Explicit subsidies (paid to the consumer or the supplier) result in undercharging consumers for the full supply costs of the coal, oil or gas they use. Implicit subsidies result from not charging or undercharging for the environmental and social damages and from foregone tax revenues.
Across 170 countries surveyed by the IMF in 2022, total fossil fuel subsidies amounted to almost US$11 trillion roughly 7% of global GDP. The graph below, that uses US dollars, shows the global subsidies for the period 2015-2030.
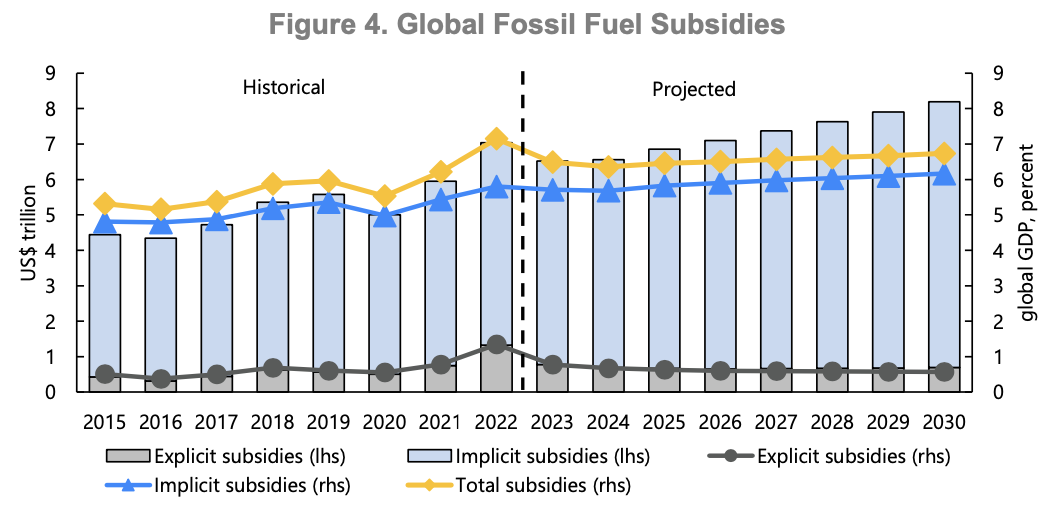
In 2022, explicit subsidies (US$2 trillion) accounted for 18% of the total, although this was elevated compared with the preceding and succeeding years by the temporary price support measures introduced to help consumers cope with the increased international fuel prices. Explicit subsidies are expected to stabilise back around US$0.5 trillion per year for the rest of the decade.
Implicit subsidies accounted for 82% of the total in 2022. This is predicted to progressively increase to around 95% by the end of the decade due to increasing environmental and health costs as emerging economies increase their use of fossil fuels.
The largest contributor to global fossil fuel subsidies in 2022 was under-pricing of the costs associated with the consequences of local air pollution and global warming (60% of the total), followed by under-pricing of supply costs and then transportation related externalities.
Subsidies for oil products accounted for 50% of the subsidies (90% were implicit subsidies), coal 30% (99.5% implicit) and gas 20% (evenly split between implicit and explicit).
In Australia in 2022, total subsidies were US$73 billion (US$2843 per person), of which US$12.5 billion were explicit and US$60.5 billion implicit. Globally, the largest subsidies were in China (US$3,490 billion), USA (US$1,182 billion) and Russia (US$657 billion), although the largest subsidies per head were in Saudi Arabia (almost US$11,000 per person).
The IMF concludes that fossil fuel price reform is necessary and timely to combat climate change, prevent unnecessary illness and premature death, ensure a societys scarce resources are appropriately, efficiently and fairly allocated, and level the playing field for clean technologies. Their recommendations include removing explicit fuel subsidies and introducing carbon taxes. They acknowledge that raising fuel prices will be politically challenging but note that savings generated by removing subsidies can be directed to assisting low income groups and increasing access to low carbon alternatives. Interestingly, the IMF makes no reference to the inevitable bleatings of the fossil fuel industries.
Of course, one has to remember that the International Monetary Fund is a well-known hotbed of anarchists, Marxists and revolutionaries bent on recklessly overthrowing the stable international rules-based world order which is responsible for preserving the global prosperity, justice, peace and environmental sustainability that we all enjoy.
In summary, despite the well-recognised perverse nature of fossil fuel subsidies, despite their presence being an obvious indication of a market failure, despite reforming the subsidies being in countries own best interests (apart from anything else they could prevent 1.6 million premature deaths per year from air pollution), and despite the Paris Agreement in 2015:
- explicit fossil fuel subsidies have not so far decreased and are not predicted to decrease over the next seven years, and
- implicit fossil fuel subsidies have been steadily increasing since 2015 and will continue to do so.
So much for the superiority of the market as a mechanism for efficient pricing and distribution of goods, and so much for the Paris Agreement as a stimulus for sensible government policies.
I phantasise about standing up in a public meeting and asking Anthony Albanese, Mr Prime Minister, fossil fuel companies operating in Australia are making enormous profits from destroying the environments around their worksites, massively polluting the air and water that humans rely on daily, causing climate change, generating enormous amounts of ill health and millions of premature deaths every year, and resisting responsible actions that would reduce the severity of the environmental and social catastrophes that they have created. Can you please explain to me why it is necessary for the Australian government and the Australian people to pay them massive subsidies.
Coal and oil use increasing
Coal and oil may have limited lifetimes but, strongly assisted by subsidies from the public purse, they are kicking on strongly in their old age.
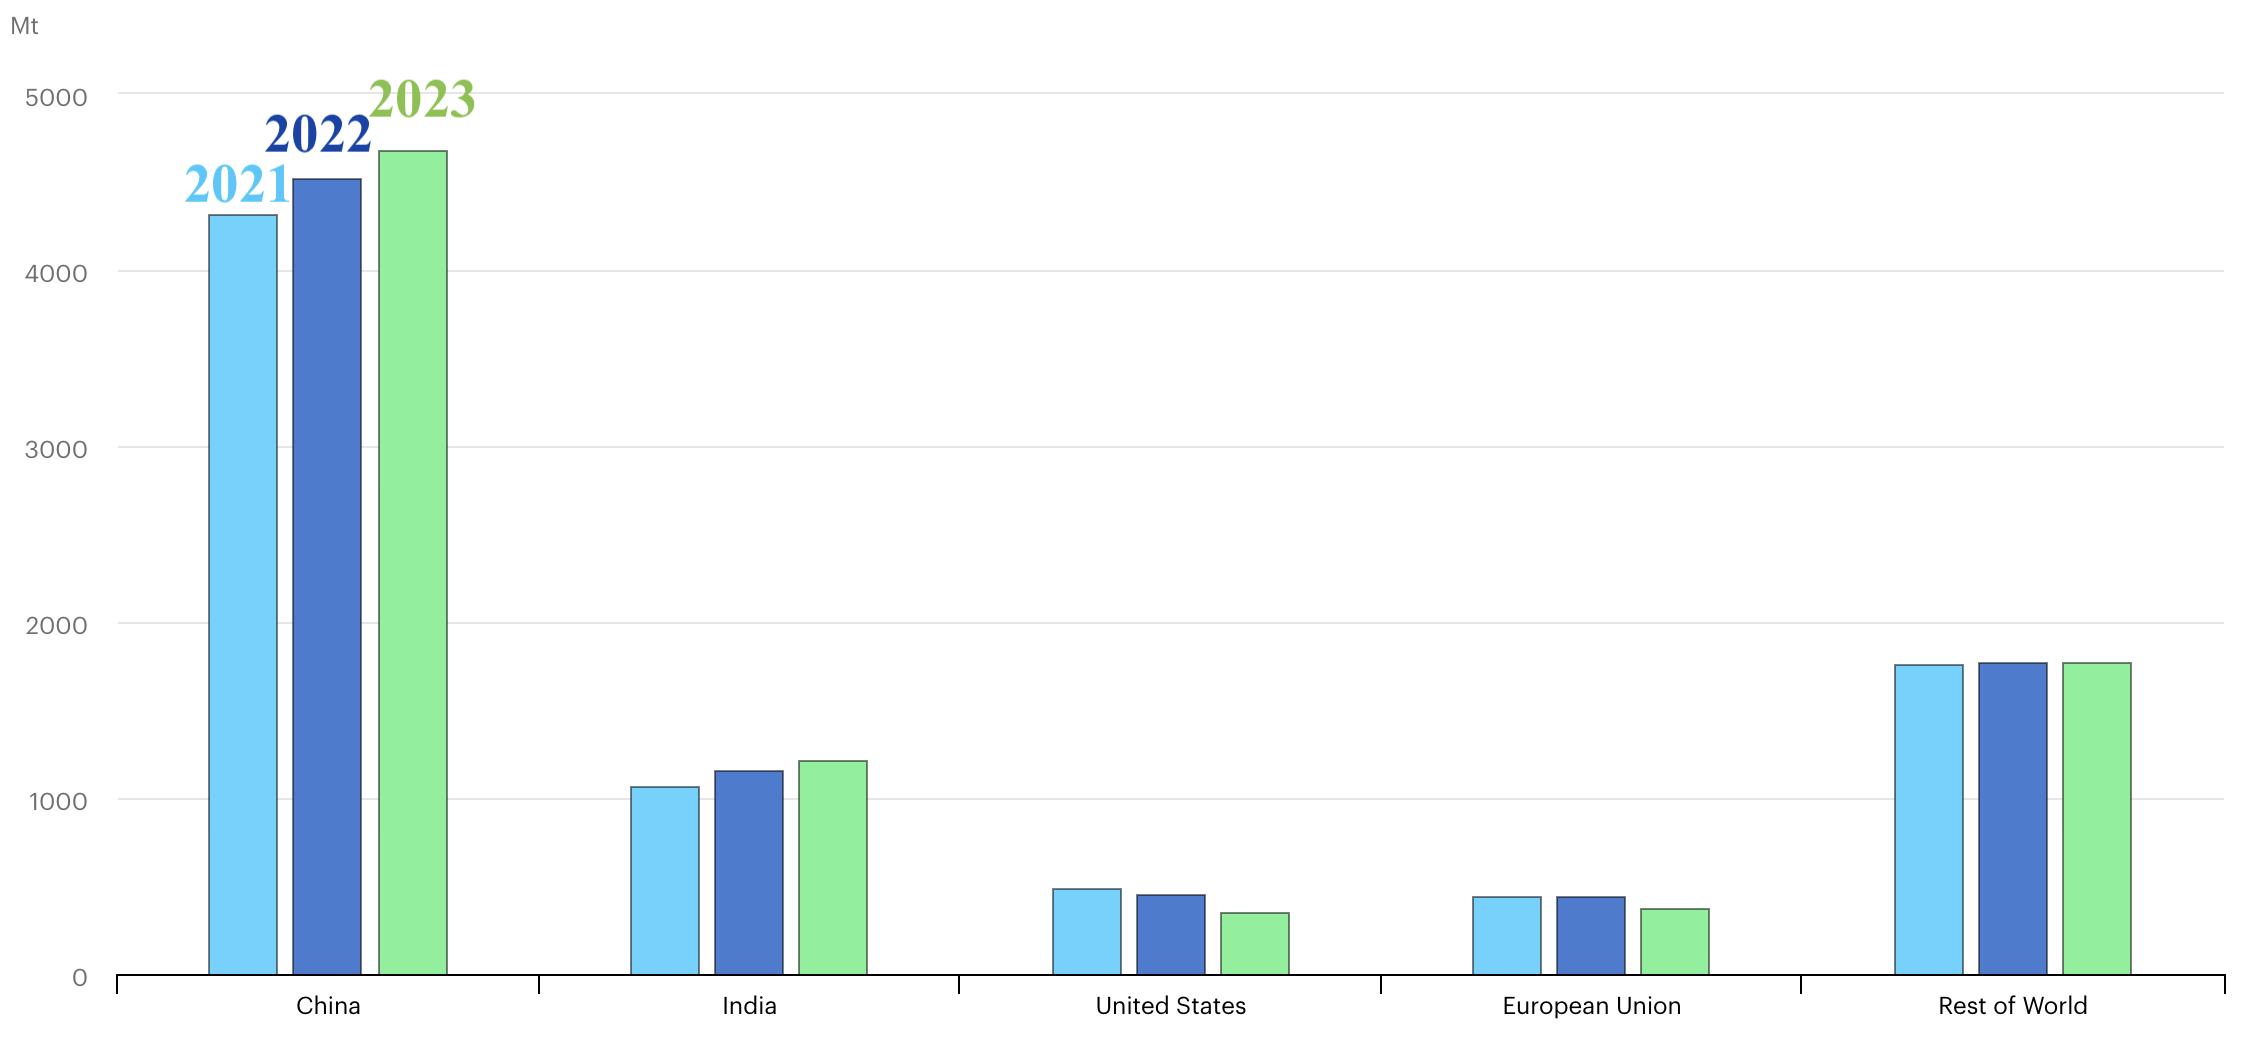
Global coal consumption, 2021-2023
In 2022, the global demand for coal increased to over 8.3 billion tonnes and coal produced a record high of 36% of the worlds electricity, up 1% on the previous year. This was largely explained by it being more available and cheaper than gas. Apart from China and India, Indonesia also increased its coal consumption (by 36%!) in 2022. The top five coal-using nations are now China, India, USA, Russia and Indonesia. Coal consumption is predicted to increase again in 2023.
The worlds demand for oil also attained new heights in 2022, reaching 100 million barrels per day (mb/d). The increase is largely attributable to soaring air travel during the northern summer, increased use of oil in power generation, and booming Chinese petrochemical activity. Demand is set to increase by a further 2% in 2023; 70% of the growth is in China. But wait, theres good news: oil demand is projected to increase by only 1% in 2024. All this has been achieved by countries depleting their oil stocks because the oil producing nations have been reducing their outputs.
Electricity 1900-2017
The three graphs below demonstrate some interesting trends in the production and use of electricity globally between 1900 and 2017.
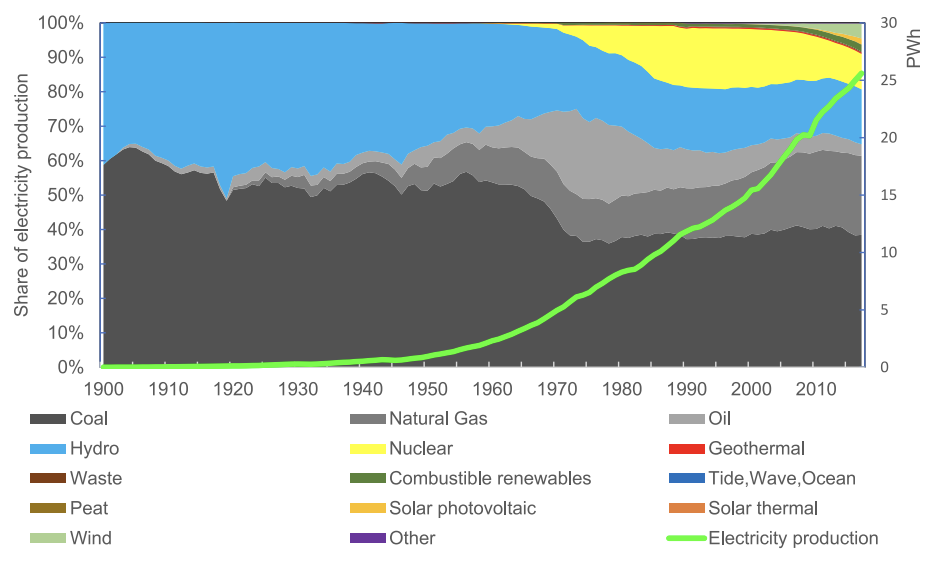
The first graph demonstrates that there was very little electricity produced (green line, right hand axis) until after the second world war when production took off and has never looked back. This pattern is seen with many measures of human activity and has been termed the Great Acceleration. Until 1950, nearly all the (relatively little and far from evenly distributed) electricity generated globally came from coal and hydro. Since 1950, coal and hydros share of the production pie has decreased and has been somewhat replaced by gas and nuclear (not so much by oil now). Renewables make a small and very late appearance on the scene but remember this story stops at 2017 and there has been a little further roll out of renewables since then.
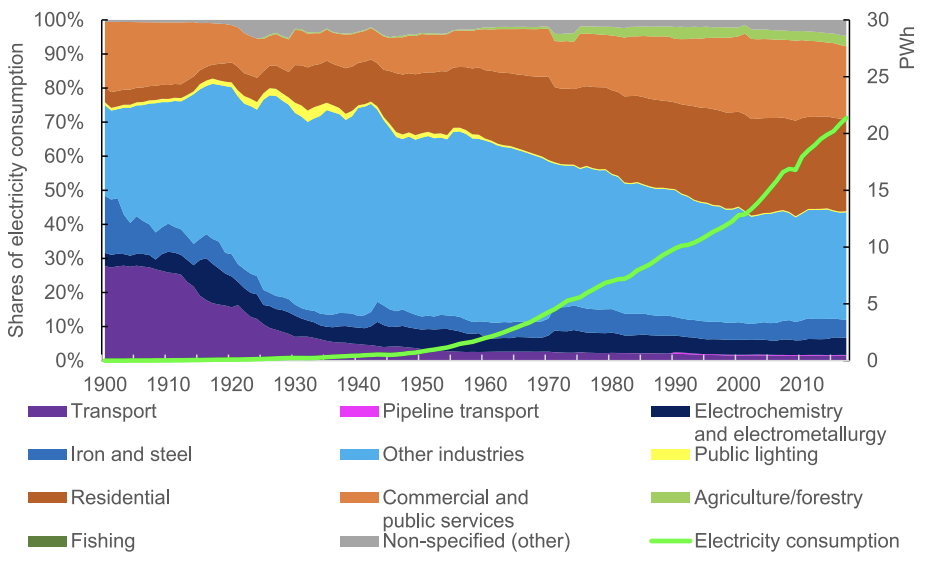
Looking next at the shares of the electricity pie consumed by various sectors of the economy, and simply comparing 1900 with 2017, its remarkable that there are really only two significant movers: Transport has withered from over 25% to 2-3% and Commercial and public services has increased from about 5% to over 25%.
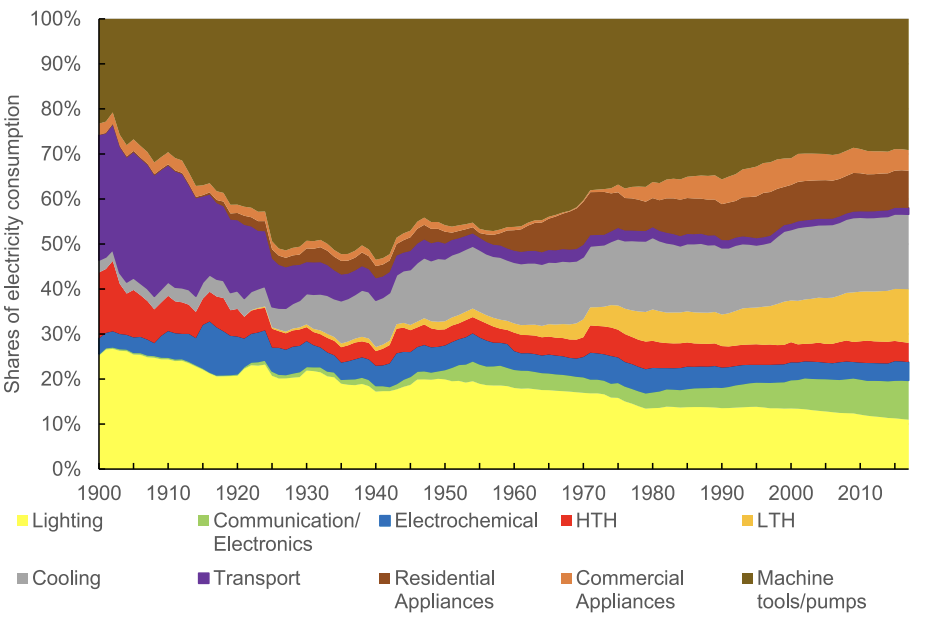
The third graph examines the percentage of electricity consumed globally in terms of the end users. If we look just at 1950 to 2017 (the period of the Great Acceleration), the increased significance in our lives of Communications/Electronics, Low Temperature Heating (LTH), Cooling and Residential Appliances clearly stand out.
Machine tools/pumps and to a lesser extent Lighting have consumed proportionally less electricity over the last 70 years. I imagine that greater efficiency has played a part here.
Canada land of fossil fuels and horsey-police
I havent featured a Juice Media Government Promotion for a while. It seems that theyve gone international and been contracted to do some work for the Canadian Government.
Canada land of fossil fuels and government hypocrisy, like nowhere else on Earth. Oh no, sorry, I was forgetting
As ever with Juice Media, parental guidance recommended.
Lifes changing creature comforts
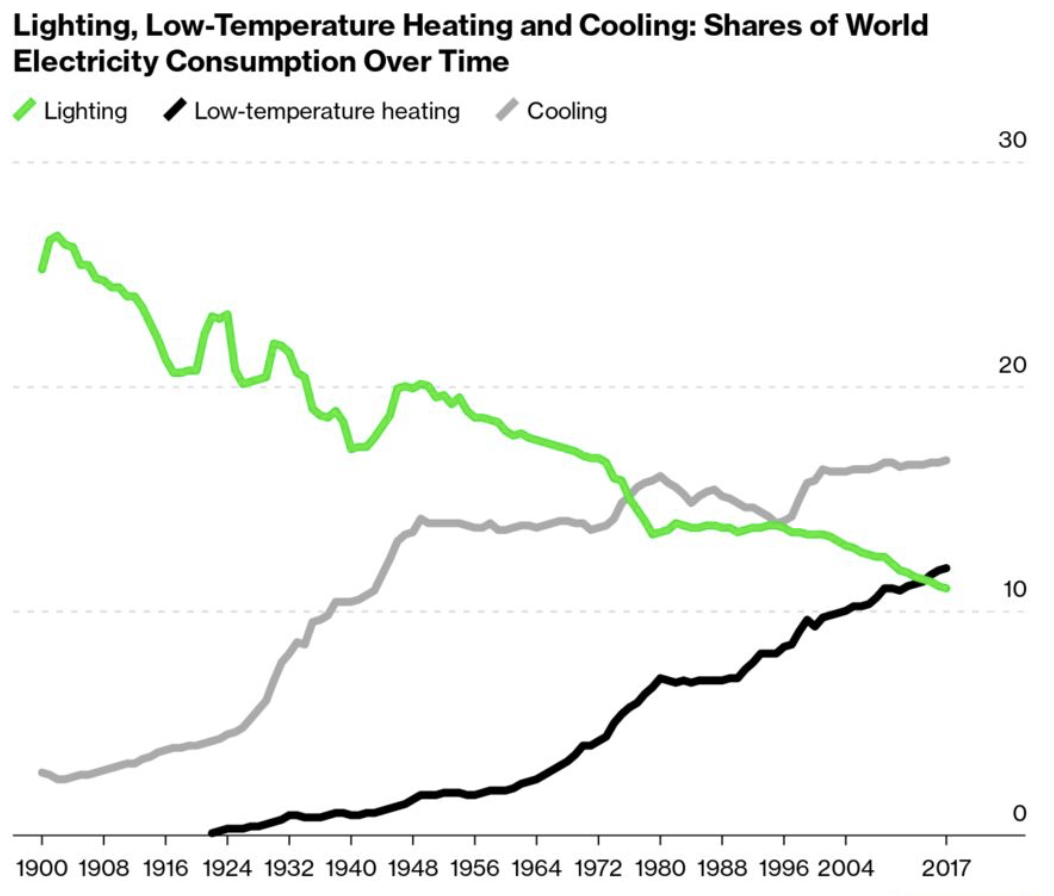
Bloomberg Green has reworked some of the electricity data in the article discussed above to produce a simple graph comparing the amount of electricity used globally by lighting, low temperature heating and cooking. The graph speaks for itself but I will point out that the actual amount of electricity being used for lighting is still growing at about 1% per year.
Born in 1951, I can remember when first of all my parents and later my wife and I progressively acquired and later upgraded various electrical appliances: fridge, washing machine, record player, TV, telephone, freezer, computer, mobile phone, toothbrush, home heating devices, etc. We havent yet got an espresso machine or heated toilet seat.